Fig. 3
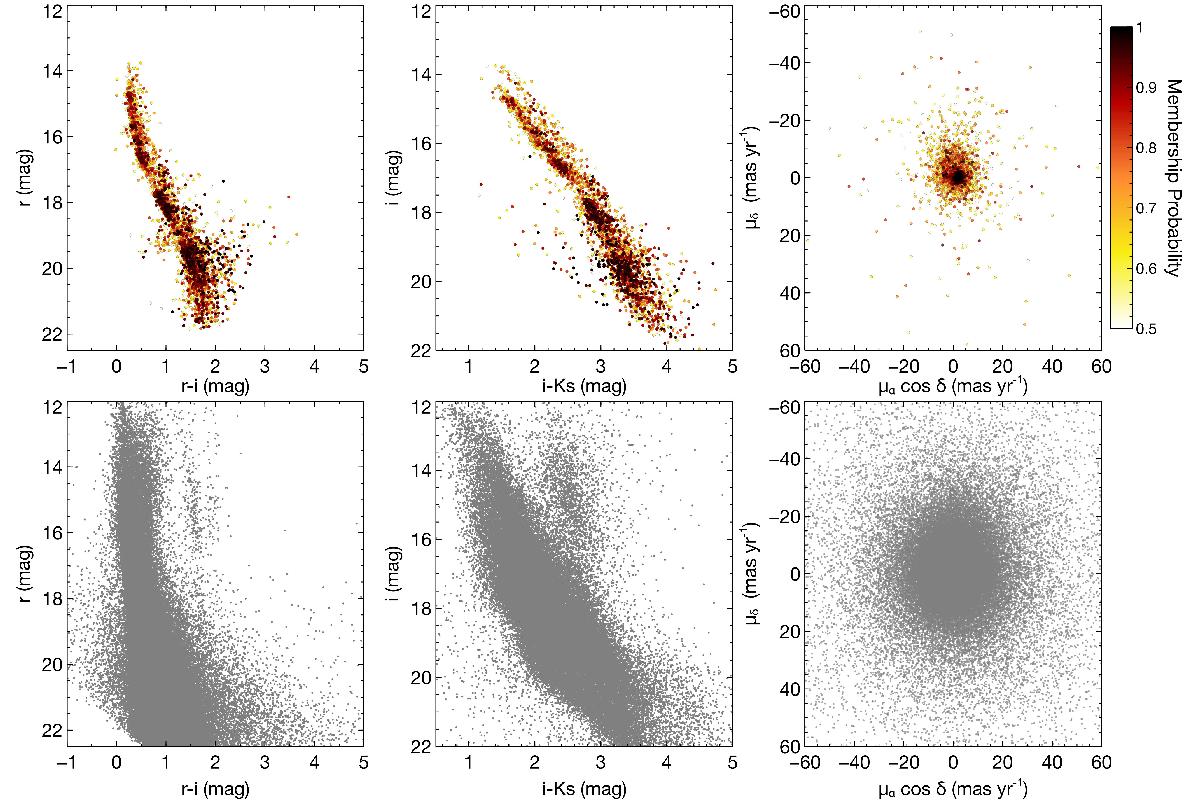
Color magnitude and proper motion diagrams of the 194 452 sources of the sample detected at more than two epochs. Left: r vs. r − i. Middle: i vs. i − Ks. Right: proper motion diagram. Sources with a membership probability greater or equal to 0.5 are represented in the top panels with a color scale proportional to their probability. The remaining sources are represented in the bottom panels.
Current usage metrics show cumulative count of Article Views (full-text article views including HTML views, PDF and ePub downloads, according to the available data) and Abstracts Views on Vision4Press platform.
Data correspond to usage on the plateform after 2015. The current usage metrics is available 48-96 hours after online publication and is updated daily on week days.
Initial download of the metrics may take a while.