Fig. 8
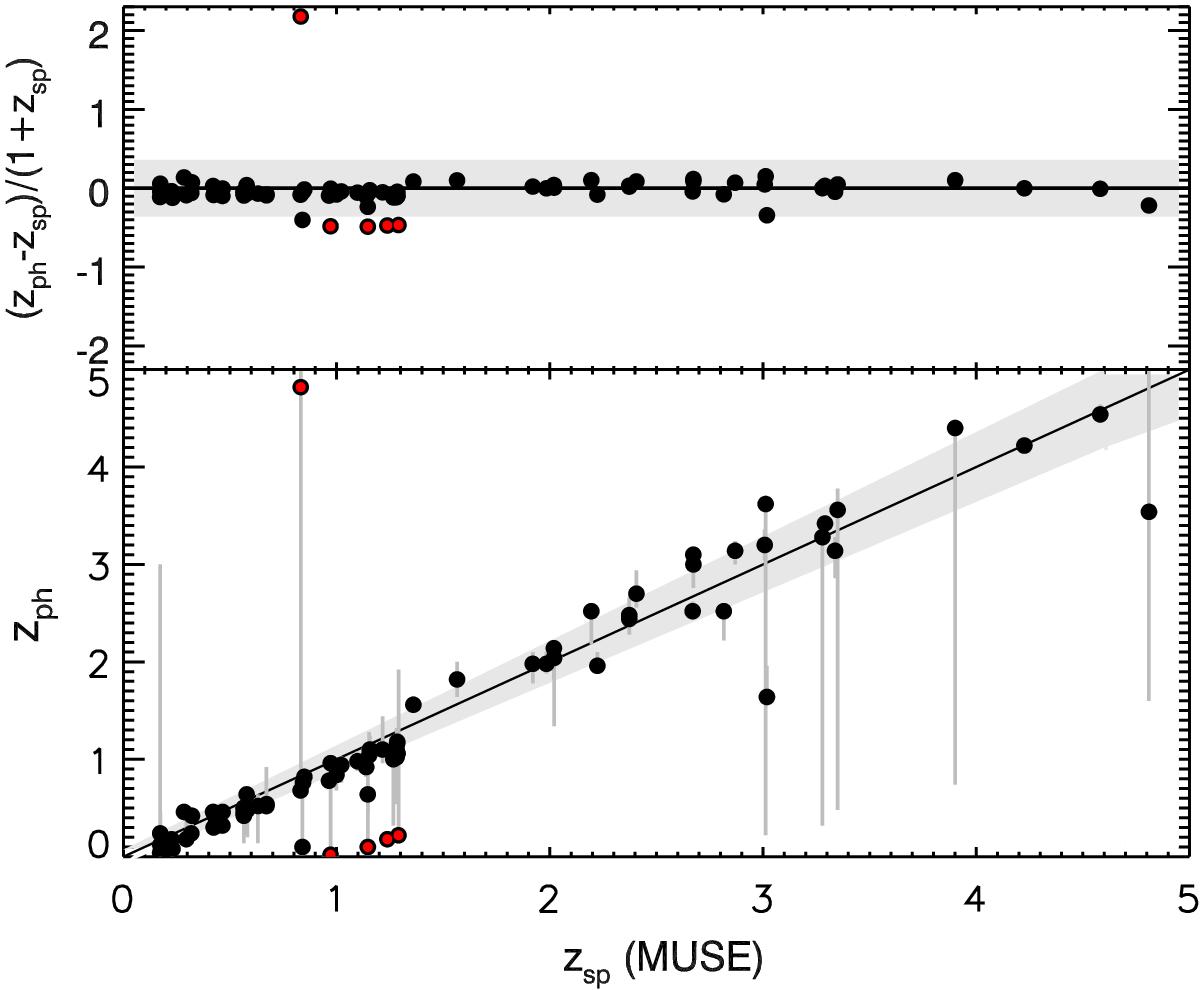
Comparison of MUSE spectroscopic redshifts with the photometric redshifts of Labbé et al. (2003). Upper panel: distribution of Δz as a function of MUSE zsp with outliers highlighted in red. The error bars shows the uncertainties reported by Labbé et al. The grey shaded area depicts the region outside of which objects are considered outliers. Lower panel: direct comparison of MUSE zsp and Labbé et al. (2003)zph with outliers again highlighted in red.
Current usage metrics show cumulative count of Article Views (full-text article views including HTML views, PDF and ePub downloads, according to the available data) and Abstracts Views on Vision4Press platform.
Data correspond to usage on the plateform after 2015. The current usage metrics is available 48-96 hours after online publication and is updated daily on week days.
Initial download of the metrics may take a while.