Fig. 7
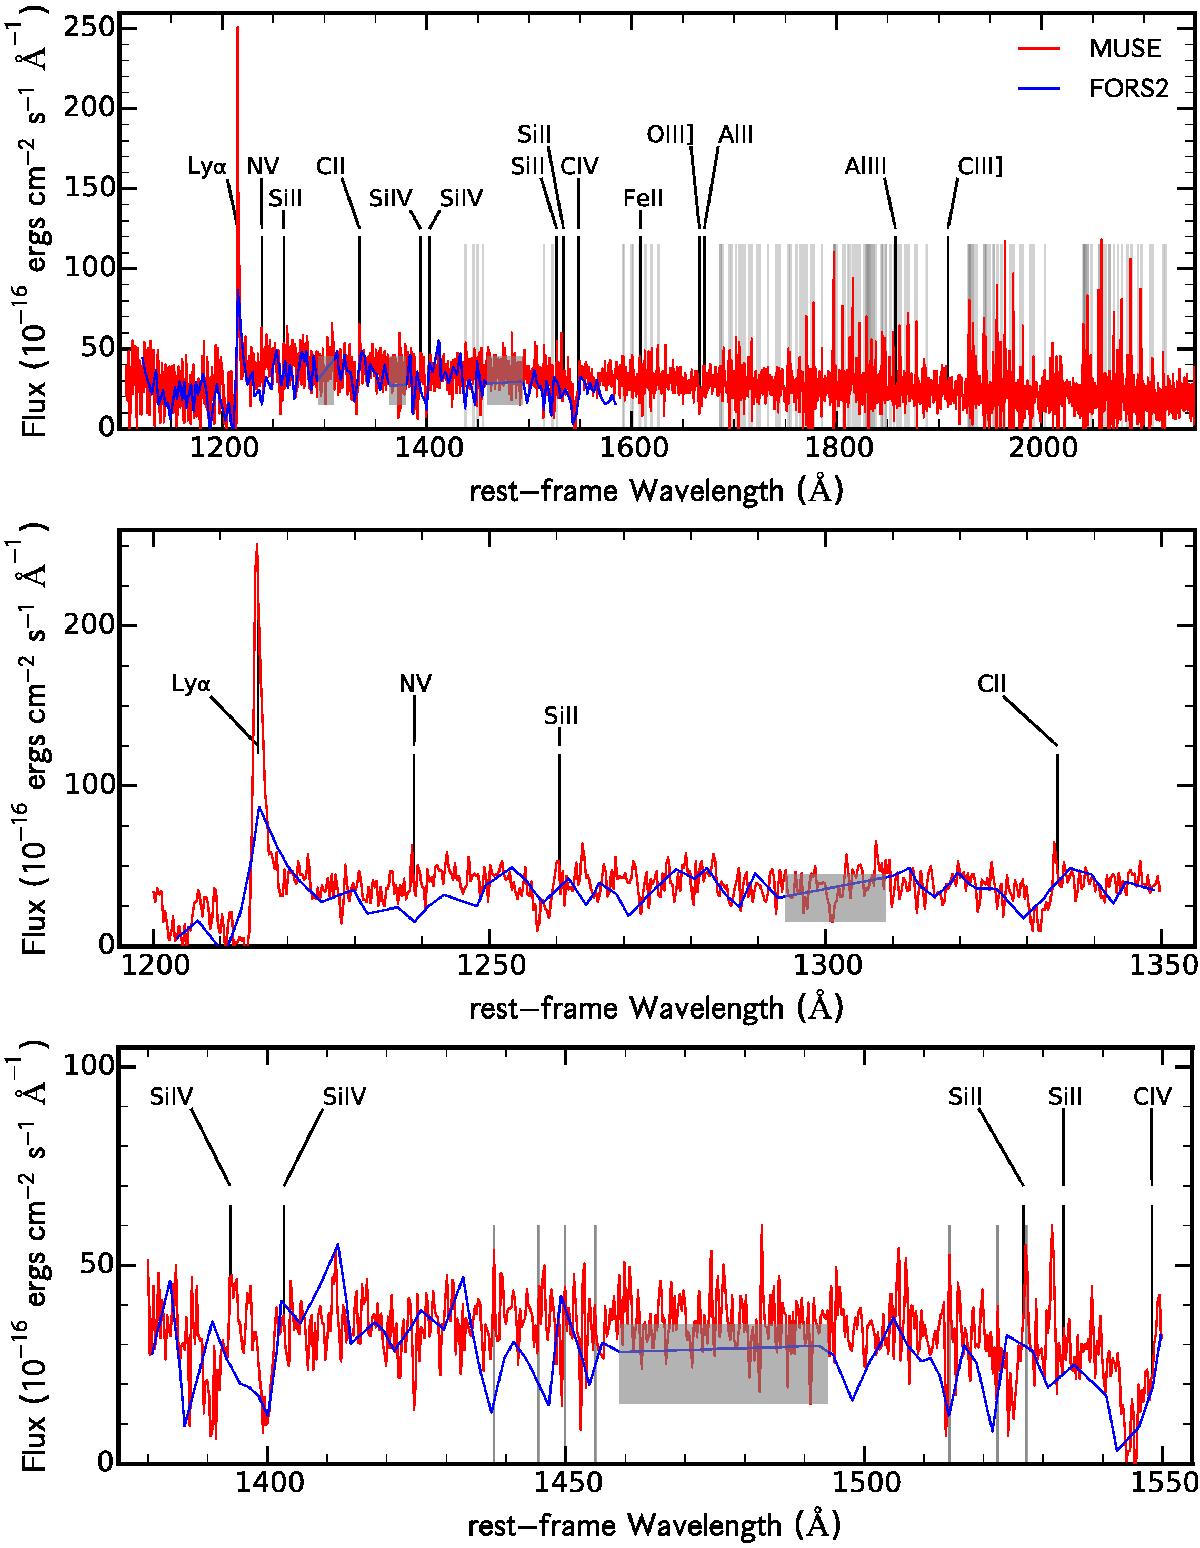
Comparison between the MUSE (red) and FORS2 spectra of Iwata et al. (2005; blue) for the galaxy ID#43, a strong Lyα emitter at zMUSE = 3.2925. The strongest spectral features are indicated in black. The grey lines show the position of the sky lines; grey areas show wavelength regions for which no FORS2 spectrum was published. Upper panel: entire spectra; middle and lower panels: zoom on the Lyα and 1380−1550 Å region, respectively; the latter contains strong SiIV absorption features.
Current usage metrics show cumulative count of Article Views (full-text article views including HTML views, PDF and ePub downloads, according to the available data) and Abstracts Views on Vision4Press platform.
Data correspond to usage on the plateform after 2015. The current usage metrics is available 48-96 hours after online publication and is updated daily on week days.
Initial download of the metrics may take a while.