Fig. 19
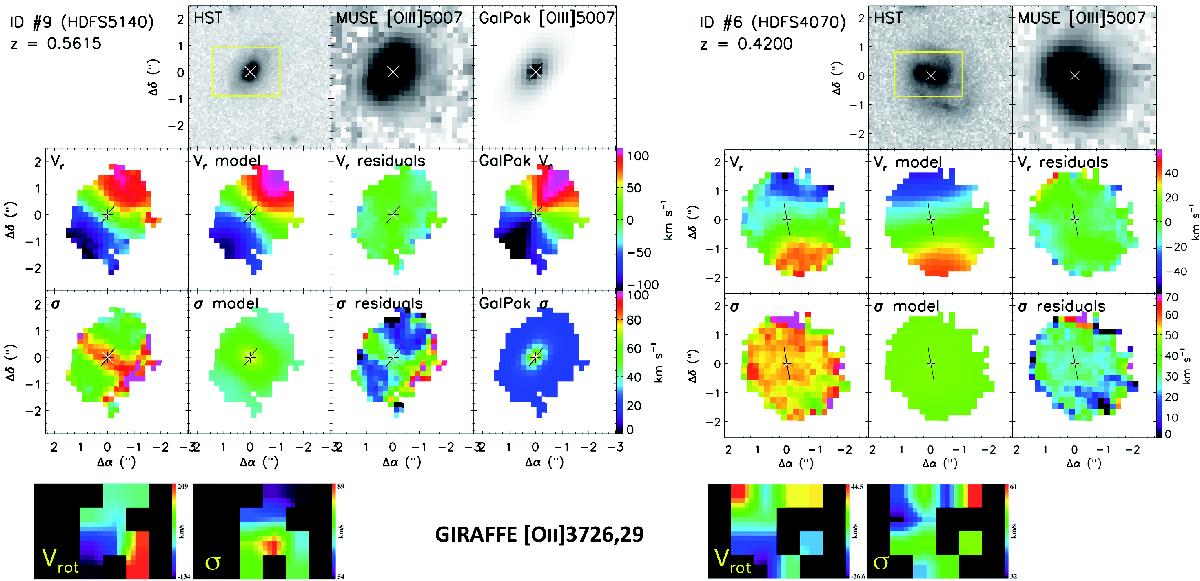
Morpho-kinematics of HDFS5140 (left) and HDFS4070 (right). For each galaxy and from left to right. Top: HST/WFPC2 F814W image in log scale (the yellow rectangle shows the GIRAFFE FoV), the MUSE [O iii]λ5007 flux map, and the deconvolved [O iii]λ5007 flux map from GalPaK3D (for HDFS5140 only). Middle: MUSE observed velocity field from Hβ and [O iii], velocity field of the 2D rotating disk model, residual velocity field, and deconvolved [O iii]λ5007 velocity field from GalPaK3D (for HDFS5140 only). Bottom: MUSE observed velocity dispersion map from Hβ and [O iii], velocity dispersion map deduced from the 2D velocity field model (beam-smearing effect and spectral PSF), deconvolved velocity dispersion map, and deconvolved [O iii]λ5007 velocity dispersion from GalPaK3D (for HDFS5140 only). In each map, north is up and east is left. The centre used for kinematical modelling is indicated as a white cross, the position angle is indicated by the black line which ends at the effective radius. For comparison, the published velocity field and dispersion map obtained with GIRAFFE for HDFS5140 (Puech et al., 2006) and HDFS4070 (Flores et al., 2006) are shown in the bottom row.
Current usage metrics show cumulative count of Article Views (full-text article views including HTML views, PDF and ePub downloads, according to the available data) and Abstracts Views on Vision4Press platform.
Data correspond to usage on the plateform after 2015. The current usage metrics is available 48-96 hours after online publication and is updated daily on week days.
Initial download of the metrics may take a while.