Fig. 18
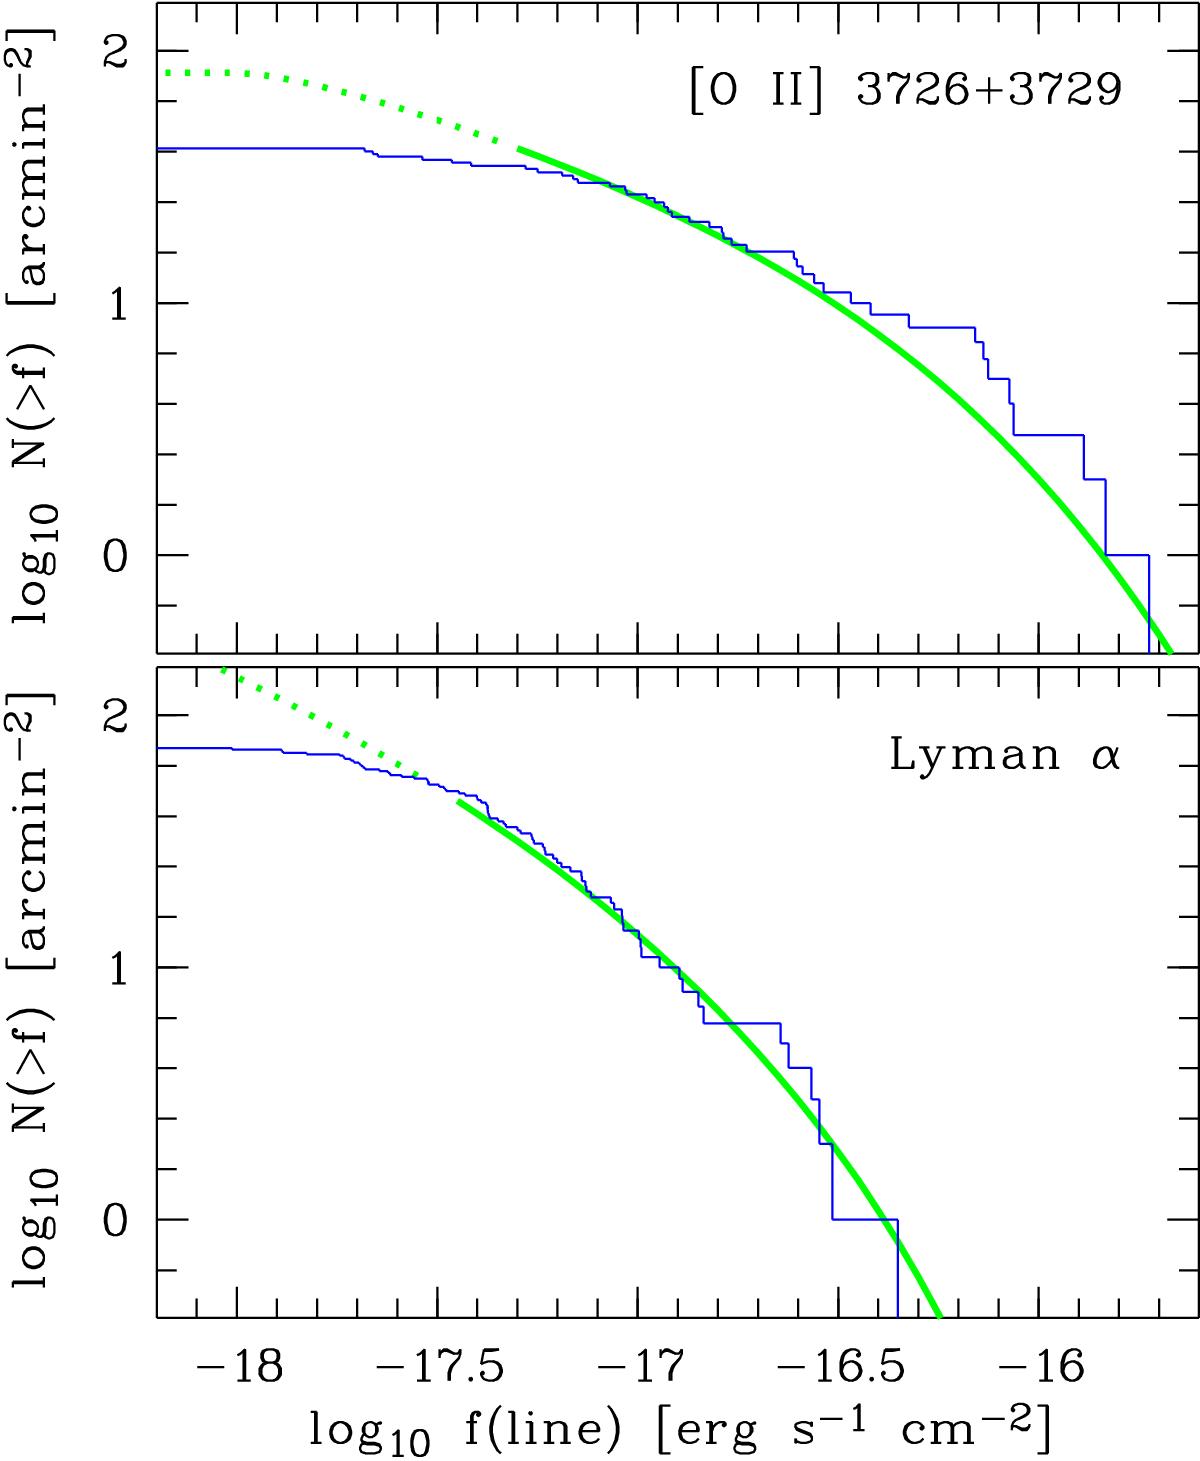
Cumulative number counts of emission line galaxies in the HDFS, as a function of line flux. Top panel: [O ii] emitters; bottom panel: Lyα emitters. The green lines show the predictions for the relevant redshift ranges (0.288 <z< 1.495 and 2.95 <z< 6.65, respectively), using a compilation of published luminosity functions as described in the text.
Current usage metrics show cumulative count of Article Views (full-text article views including HTML views, PDF and ePub downloads, according to the available data) and Abstracts Views on Vision4Press platform.
Data correspond to usage on the plateform after 2015. The current usage metrics is available 48-96 hours after online publication and is updated daily on week days.
Initial download of the metrics may take a while.