Fig. 16
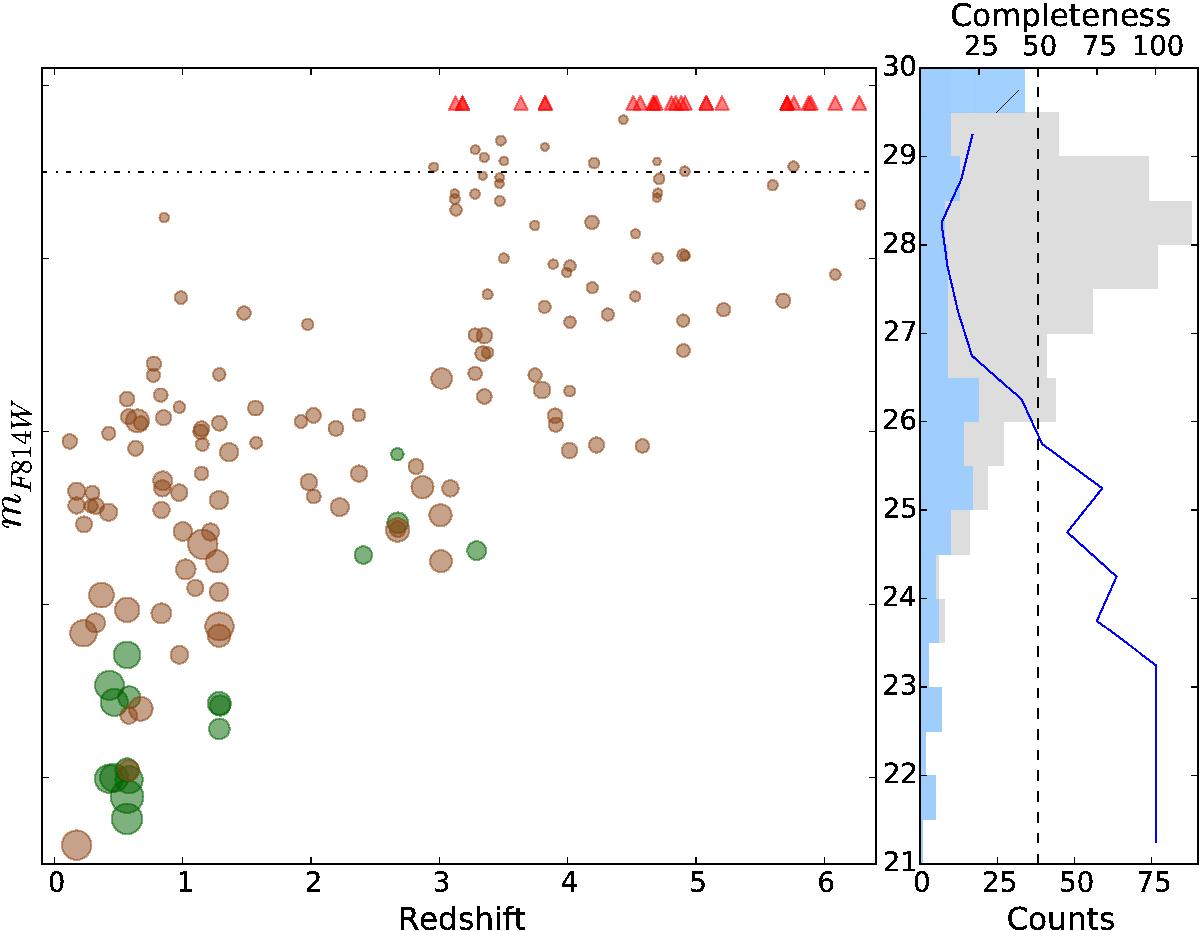
Redshift distribution of sources in the HDFS MUSE field. Left: redshift versus HST I814AB magnitude. The symbol size is proportional to the object’s HST size. The green circles are for the published spectroscopic redshifts and the brown symbols for the new MUSE measurements. The red arrows show objects without HST counterparts. The dashed line shows the 3σ detection limit for the HST F814W images. Right: the grey histogram shows the distribution of all magnitudes in the HST catalogue while the light blue histogram shows the magnitude distribution of those galaxies with confirmed redshifts and HST counterparts. The last histogram bar centred at I814 = 29.75 is for the Lyα emitters not detected in the HST image. The blue curve gives the completeness of the redshift identification with respect to the identified sources in the HST images.
Current usage metrics show cumulative count of Article Views (full-text article views including HTML views, PDF and ePub downloads, according to the available data) and Abstracts Views on Vision4Press platform.
Data correspond to usage on the plateform after 2015. The current usage metrics is available 48-96 hours after online publication and is updated daily on week days.
Initial download of the metrics may take a while.