Fig. 15
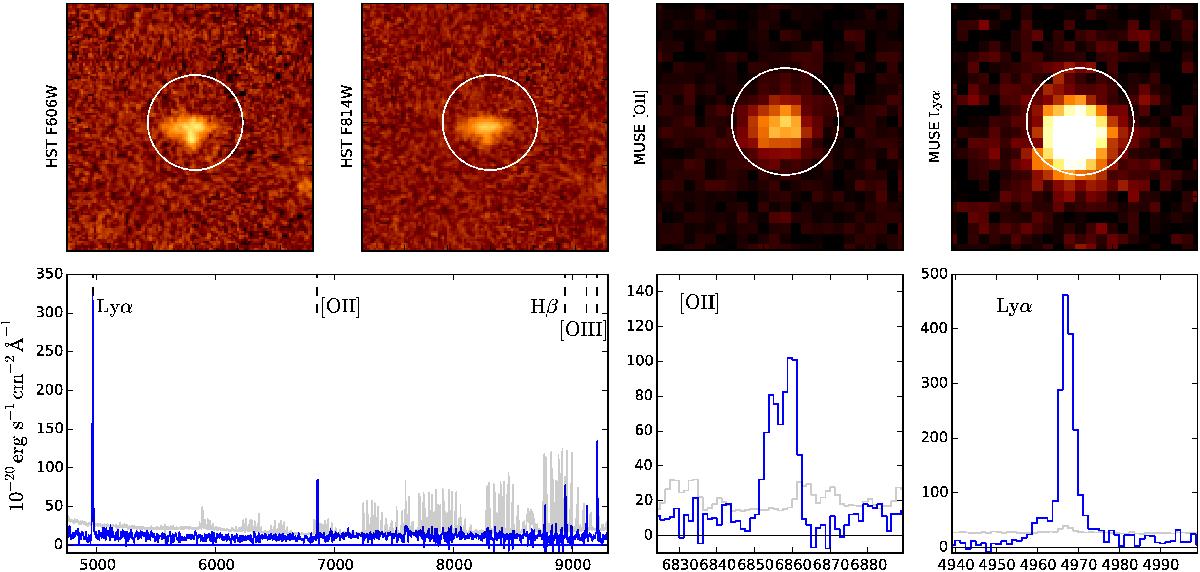
Example of spatially overlapping objects: a z = 3.09 Lyα emitter (ID#71) with a z = 0.83 [OII] emitter (ID#72). The HST images in F606W and F814W filters are shown at the top left, the MUSE Lyα and [O ii] images at the top right. The one arcsec radius red circles show the object location derived from the HST image. At the bottom left, the full spectrum (in blue), smoothed with a 4 Å boxcar, and its 3σ error (in grey) are displayed. A zoom of the unsmoothed spectrum, centred around the Lyα and [O ii]3727 emission line, is also shown at the bottom right.
Current usage metrics show cumulative count of Article Views (full-text article views including HTML views, PDF and ePub downloads, according to the available data) and Abstracts Views on Vision4Press platform.
Data correspond to usage on the plateform after 2015. The current usage metrics is available 48-96 hours after online publication and is updated daily on week days.
Initial download of the metrics may take a while.