Free Access
Fig. 4
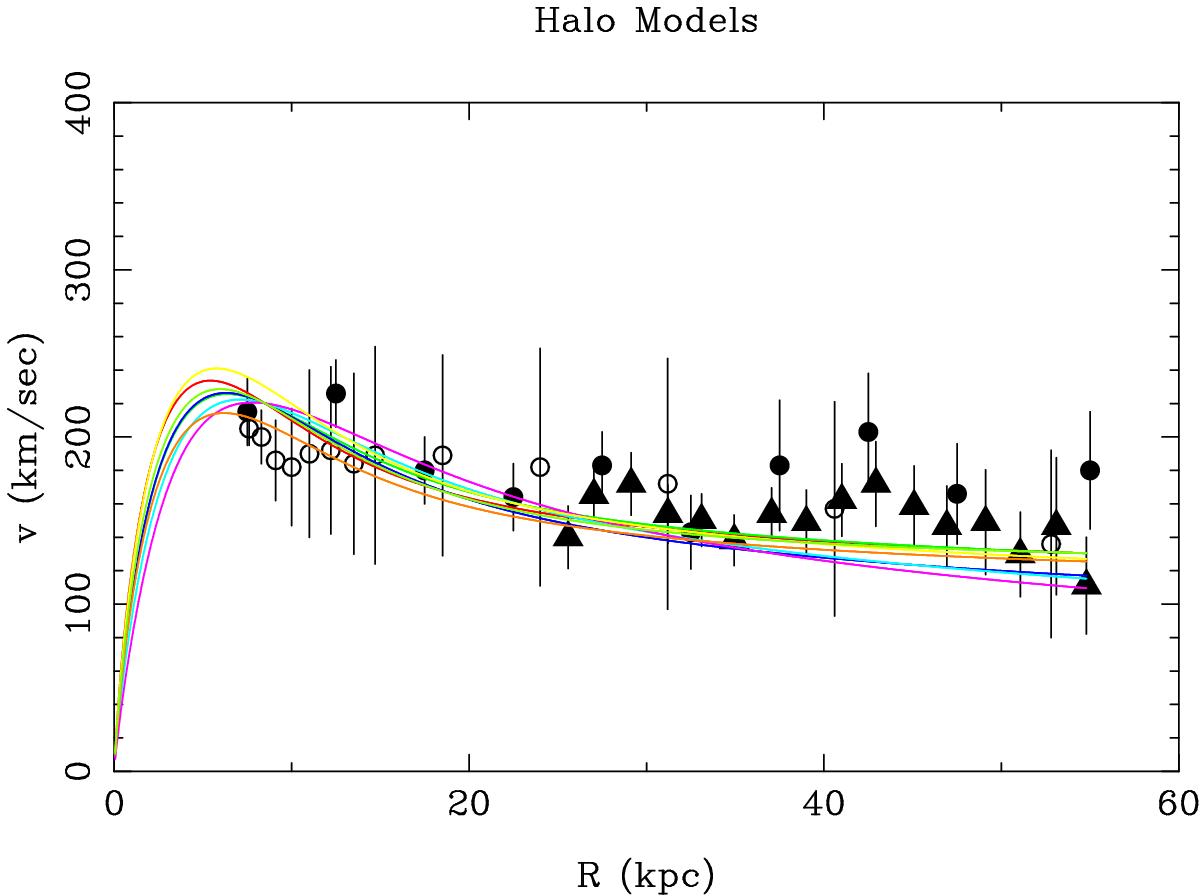
Rotation curves for models of the Galaxy out to 60 kpc. The observed rotation curves are shown as filled circles (Xue et al., 2008), open circles (Sofue, 2013) and filled triangles (Bhattacharjee et al., 2014). The coloured curves are for Models H1 to H8 from Table 1.
Current usage metrics show cumulative count of Article Views (full-text article views including HTML views, PDF and ePub downloads, according to the available data) and Abstracts Views on Vision4Press platform.
Data correspond to usage on the plateform after 2015. The current usage metrics is available 48-96 hours after online publication and is updated daily on week days.
Initial download of the metrics may take a while.