Fig. 2
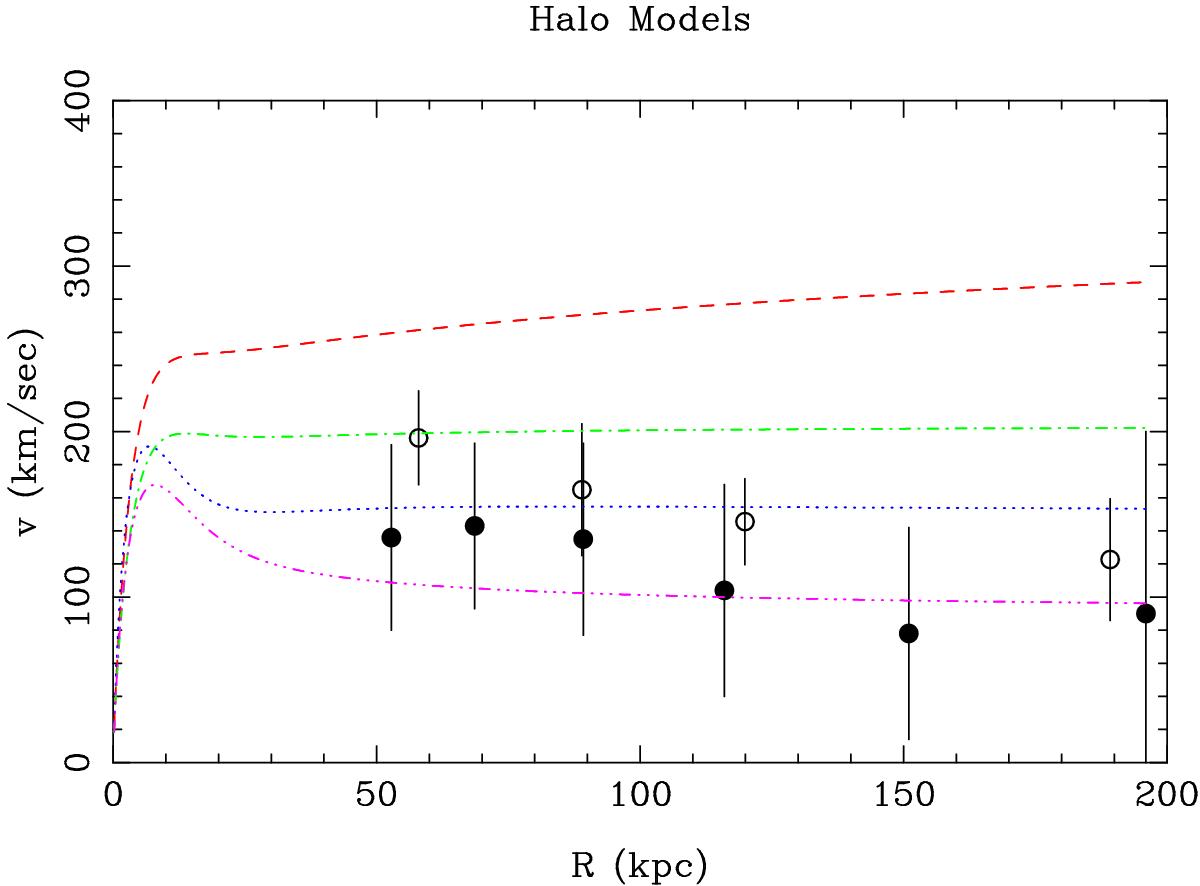
Rotation curves for models for the outer part of the Galaxy. The observed rotation curves are shown as filled circles (Sofue, 2013) and open circles (Bhattacharjee et al., 2014). The red (dashed), green (dot-dash), blue (dotted) and purple (dash-dot-dot-dot) curves are for Models B, S, F and E respectively from Alcock et al. (1996).
Current usage metrics show cumulative count of Article Views (full-text article views including HTML views, PDF and ePub downloads, according to the available data) and Abstracts Views on Vision4Press platform.
Data correspond to usage on the plateform after 2015. The current usage metrics is available 48-96 hours after online publication and is updated daily on week days.
Initial download of the metrics may take a while.