Free Access
Fig. 4
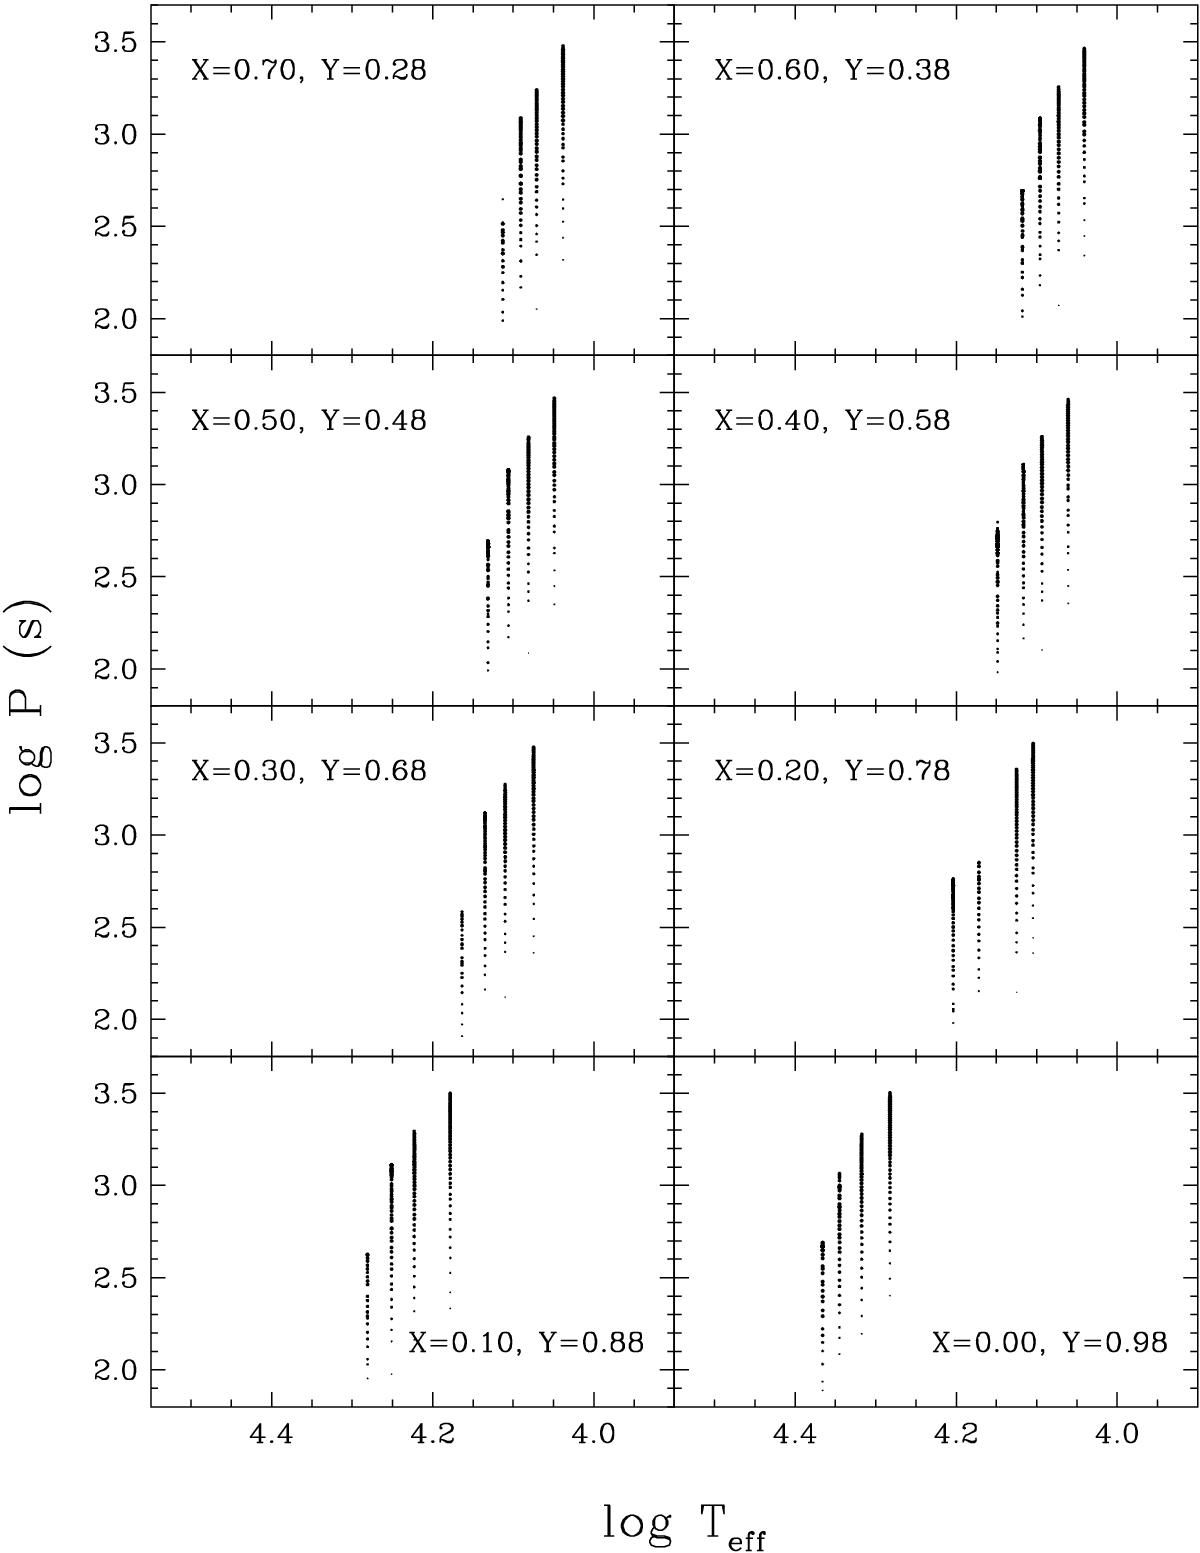
Predicted ranges of excited dipole (ℓ = 1) g-modes for representative models near the red edge of the instability strips from 1.2 M⊙ (lower left and shorter periods) to 0.3 M⊙ (upper right and larger periods). The bigger the dot, the more unstable the mode.
Current usage metrics show cumulative count of Article Views (full-text article views including HTML views, PDF and ePub downloads, according to the available data) and Abstracts Views on Vision4Press platform.
Data correspond to usage on the plateform after 2015. The current usage metrics is available 48-96 hours after online publication and is updated daily on week days.
Initial download of the metrics may take a while.