Fig. 2
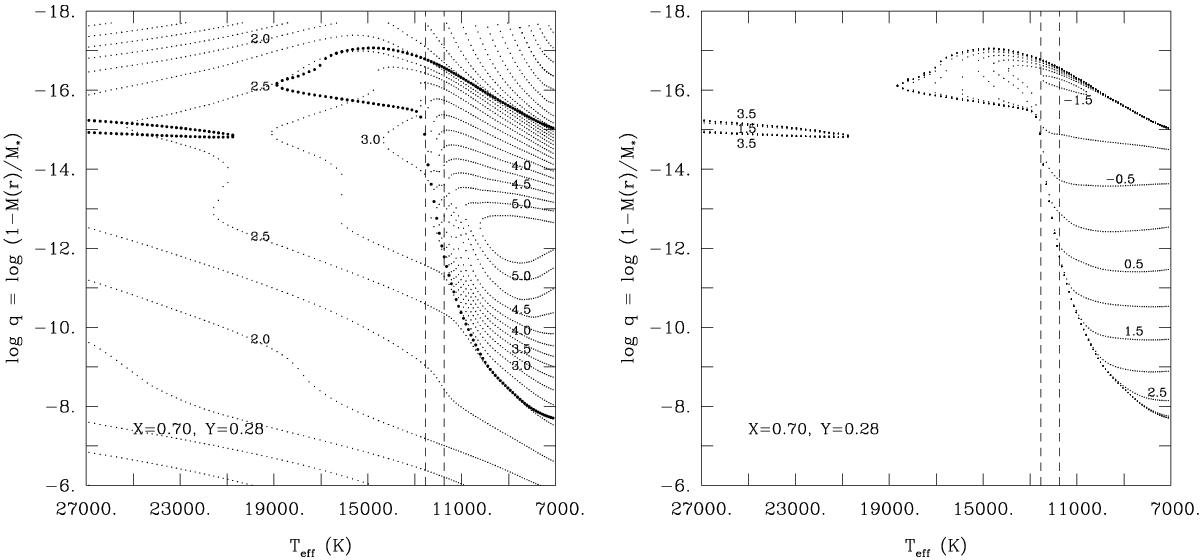
Left panel: details of the structure of the outer layers of a representative evolving 0.6 M⊙ white dwarf with a solar composition in the envelope. The ordinate gives the fractional mass depth in logarithmic units. On this scale, the center of the star is at log q = 0; only the envelope layers are depicted here. The small dots define “isocontours” of opacity, and some are labelled by their value of log κ. The small filled circles indicate the boundaries of the superficial convection zones that develop due to He and H recombination. It should be pointed out that the top of the convection zones always resides in the photospheric layers, while the base sinks deeper into the star as it cools, until degenerate conduction takes over in the cooler, more evolved phases. The vertical dashed lines indicate the blue and red edges obtained with our TDC treatment with ML2/α = 1.0. Right panel: similar to left panel, but the small dots now define isocontours of the local convective turnover timescale log τc expressed in seconds. The boundaries of the convection zones are well defined in this plot, so the small filled circles used in the left panel are not necessary.
Current usage metrics show cumulative count of Article Views (full-text article views including HTML views, PDF and ePub downloads, according to the available data) and Abstracts Views on Vision4Press platform.
Data correspond to usage on the plateform after 2015. The current usage metrics is available 48-96 hours after online publication and is updated daily on week days.
Initial download of the metrics may take a while.