Fig. 1
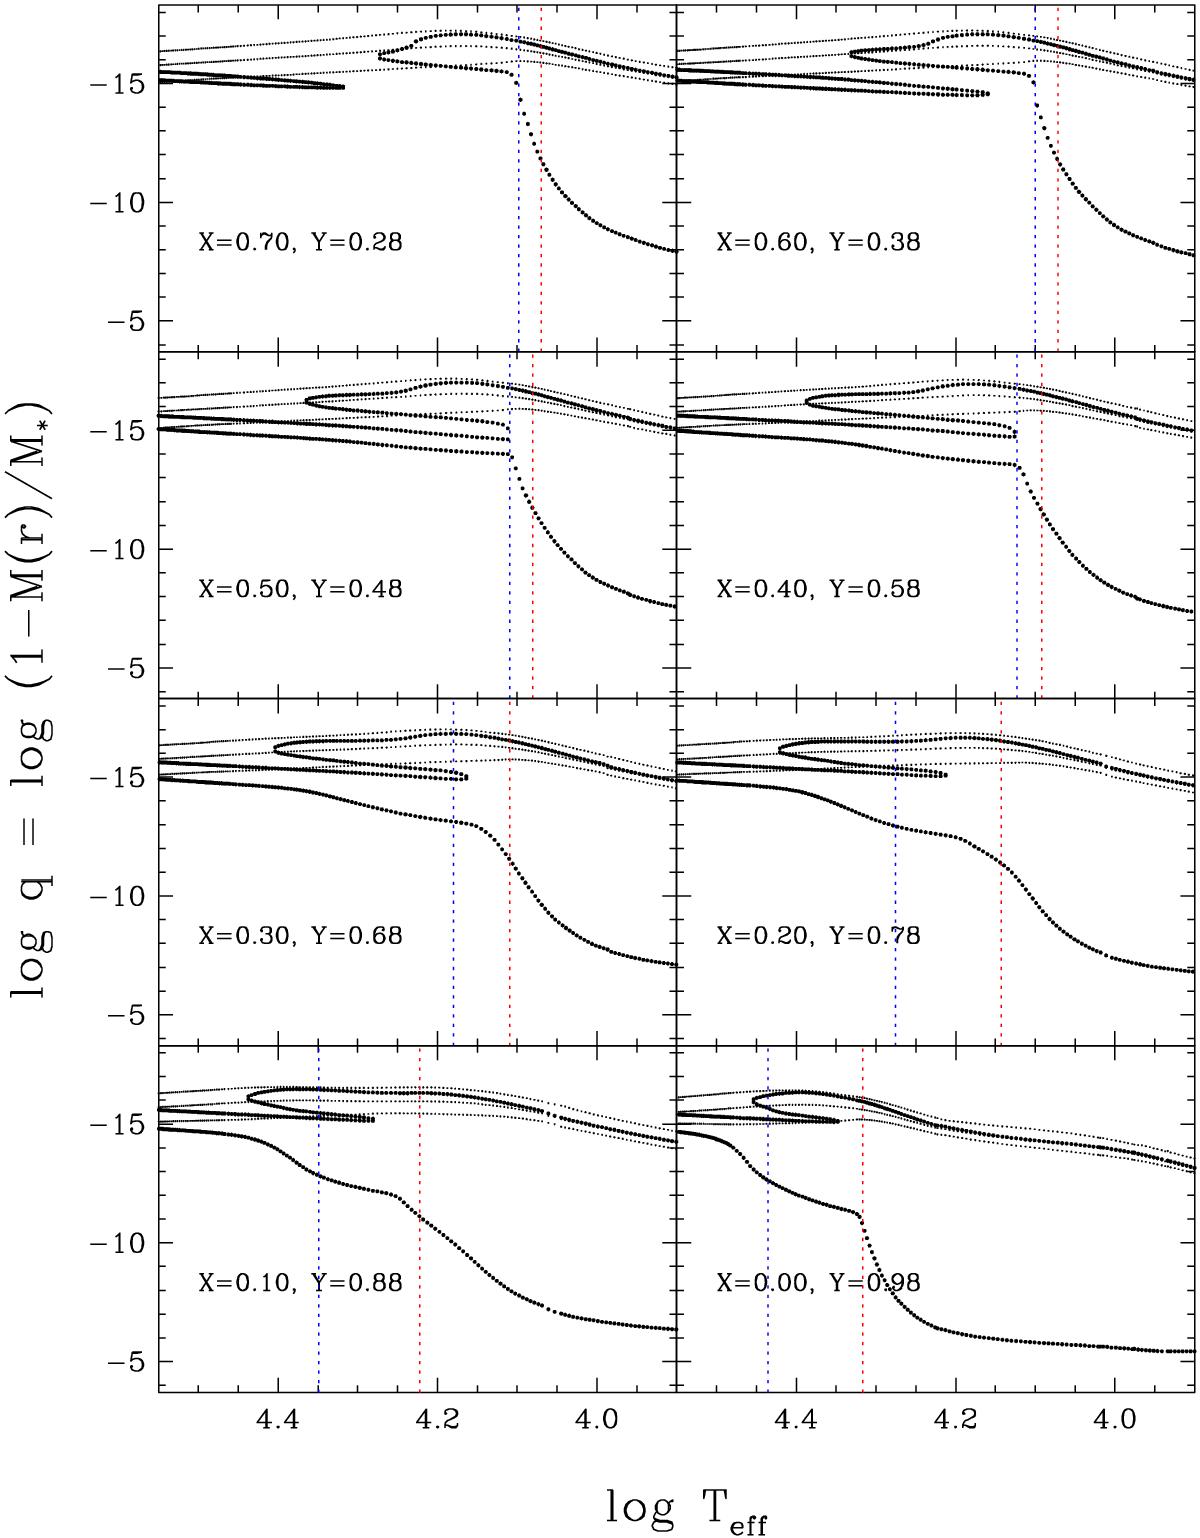
Structure of the envelope of a representative 0.6 M⊙ model, for eight different envelope chemical compositions ranging from solar (upper left quadrant of upper panel) to a H-less mixture (lower right figure of lower panel). The boundaries of the outer convection zone(s) are indicated by heavy dots. The three dotted curves in each plot correspond to a Rosseland optical depth of 0.1, 1.0, and 10.0, from top to bottom. The boundaries of the instability strip for each case considered are indicated by blue and red vertical dotted lines.
Current usage metrics show cumulative count of Article Views (full-text article views including HTML views, PDF and ePub downloads, according to the available data) and Abstracts Views on Vision4Press platform.
Data correspond to usage on the plateform after 2015. The current usage metrics is available 48-96 hours after online publication and is updated daily on week days.
Initial download of the metrics may take a while.