Fig. 9
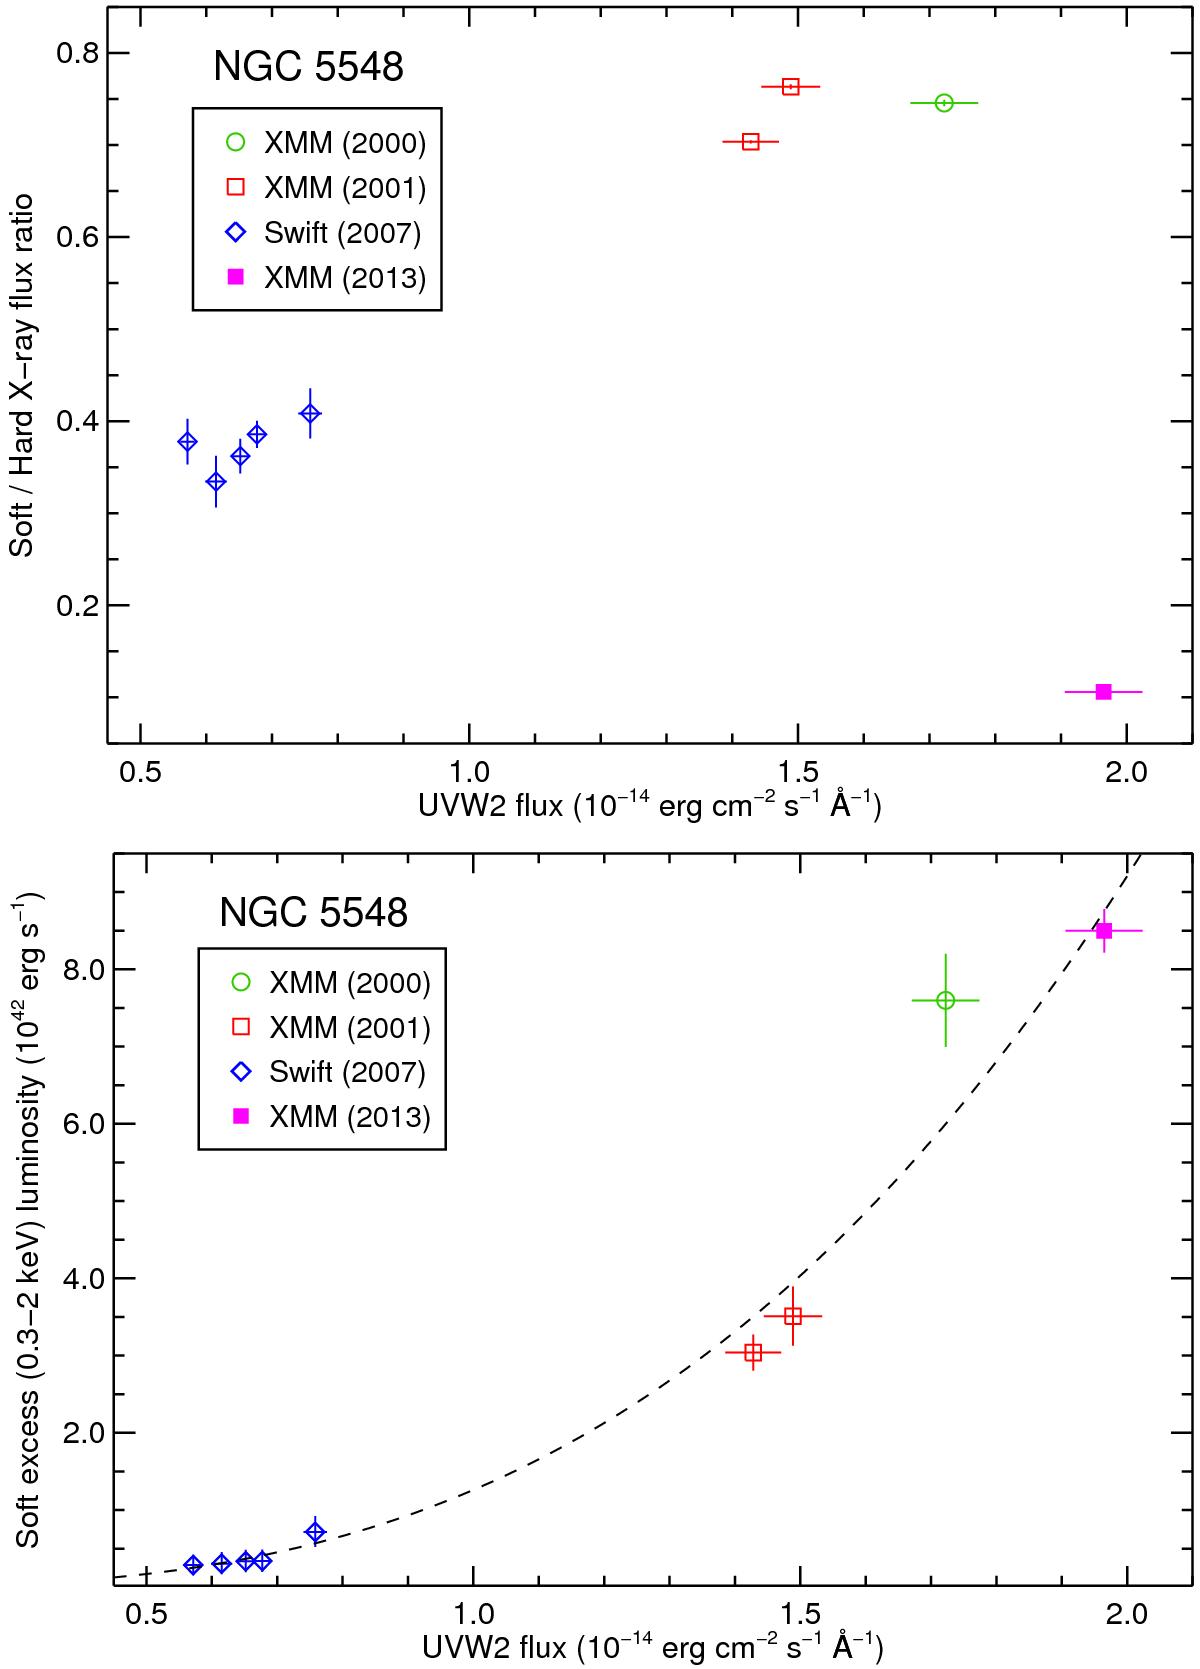
Top panel: ratio of observed soft (0.3–2.0 keV) to hard (2.0–10 keV) X-ray flux plotted versus the observed UVW2 (2030 Å) flux. Bottom panel: intrinsic luminosity of the soft excess component between 0.3–2.0 keV plotted versus the observed UVW2 (2030 Å) flux, and fitted with the power-law function given in Eq. (2).
Current usage metrics show cumulative count of Article Views (full-text article views including HTML views, PDF and ePub downloads, according to the available data) and Abstracts Views on Vision4Press platform.
Data correspond to usage on the plateform after 2015. The current usage metrics is available 48-96 hours after online publication and is updated daily on week days.
Initial download of the metrics may take a while.