Fig. 5
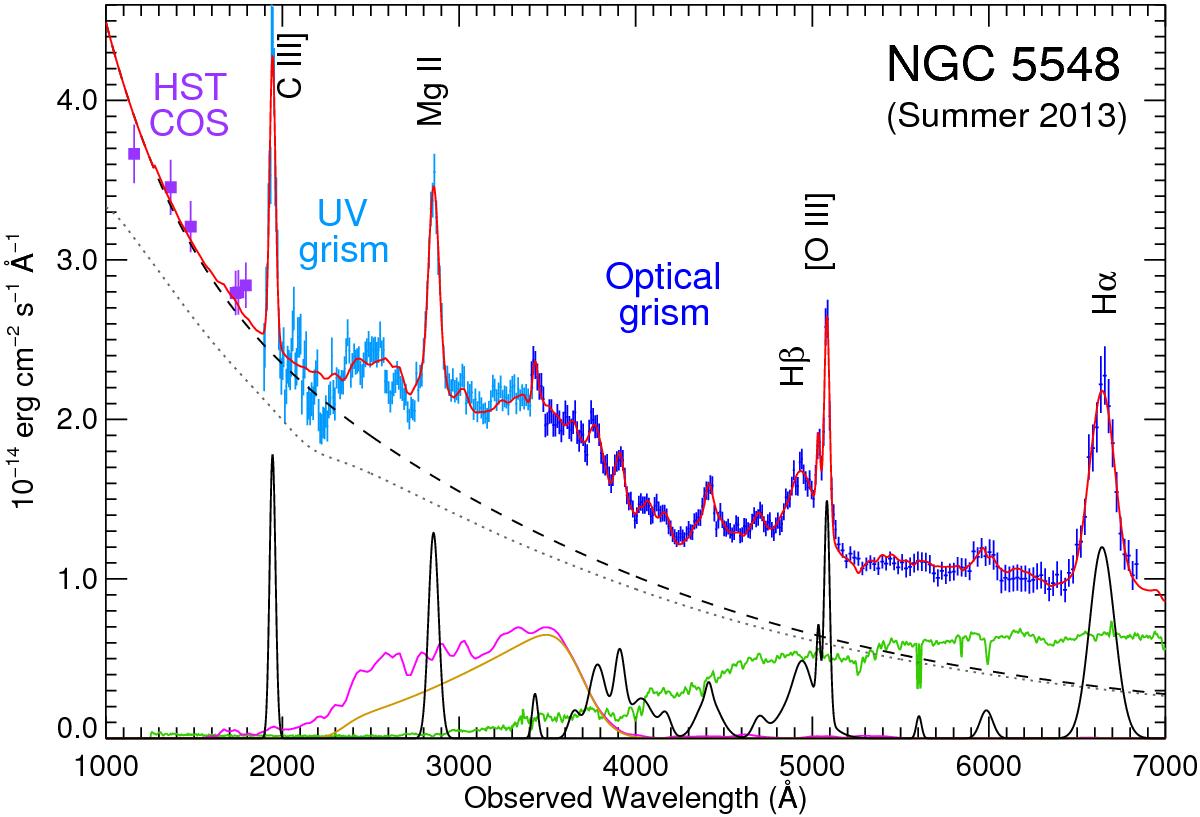
De-reddened optical/UV spectrum of NGC 5548. The displayed data are from simultaneous UVOT UV grism spectra (shown in light blue) at 1896–3414 Å, OM Optical grism spectra (shown in dark blue) at 3410–6836 Å and the six HST COS continuum points (shown as purple squares) between 1160–1793 Å. The displayed data are the average of the contemporaneous OM, UVOT and HST COS observations taken in summer 2013 and are corrected for Galactic reddening using the model described in Sect. 4.1. The best-fit model (described in Sect. 4) is shown in red and various components contributing to the model are also displayed. The underlying continuum model (comt) is the dashed black curve. The dotted black curve is the reddened version of the continuum to illustrate the correction for reddening. The broad and narrow emission line components (Sect. 4.3) are shown at the bottom and some of the prominent emission lines are labelled. The broad feature in magenta is the “small-blue-bump”: blended Fe ii emission (Sect. 4.4) with Balmer continuum (Sect. 4.5). The model for the Balmer continuum alone is shown in dark yellow below the small-blue-bump. The contribution from the host galaxy of NGC 5548 (Sect. 4.2) is shown in green.
Current usage metrics show cumulative count of Article Views (full-text article views including HTML views, PDF and ePub downloads, according to the available data) and Abstracts Views on Vision4Press platform.
Data correspond to usage on the plateform after 2015. The current usage metrics is available 48-96 hours after online publication and is updated daily on week days.
Initial download of the metrics may take a while.