Fig. 3
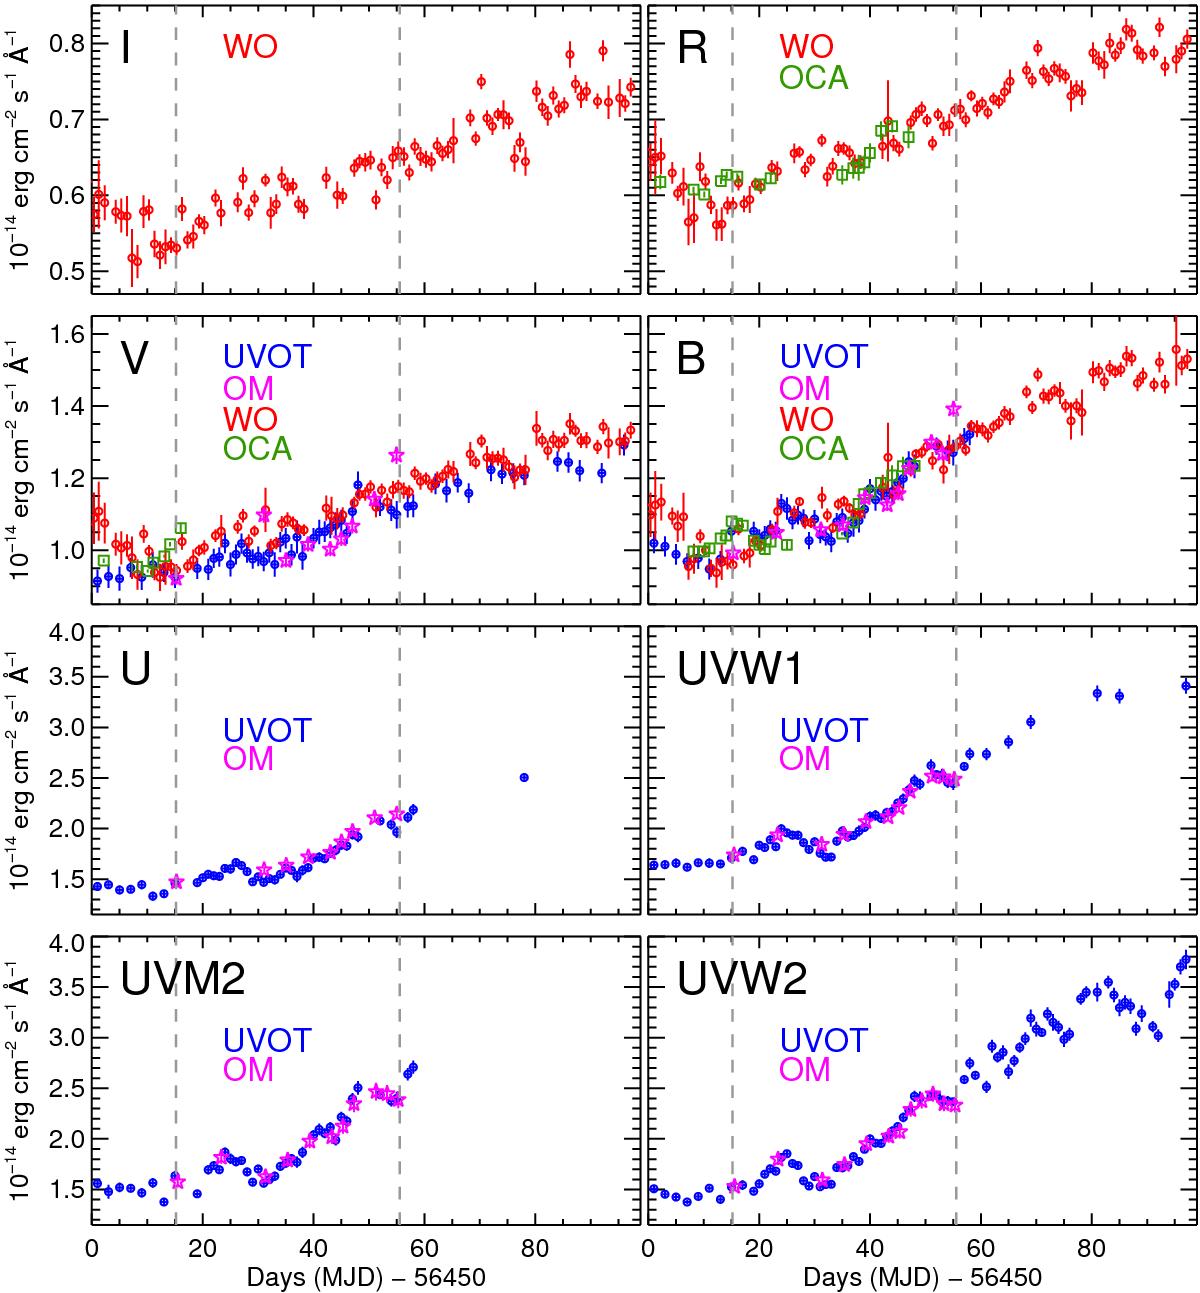
NIR, optical, and UV lightcurves of NGC 5548 taken with various filters from our summer 2013 campaign. The lightcurves show the observed energy flux and are displayed between 7 June and 14 Sep. 2013. The UVOT data are shown as blue circles, OM as magenta stars, WO as red circles, and OCA data as green squares. The vertical dashed lines indicate the interval between XMM-Newton Obs. 1 and 12.
Current usage metrics show cumulative count of Article Views (full-text article views including HTML views, PDF and ePub downloads, according to the available data) and Abstracts Views on Vision4Press platform.
Data correspond to usage on the plateform after 2015. The current usage metrics is available 48-96 hours after online publication and is updated daily on week days.
Initial download of the metrics may take a while.