Fig. 13
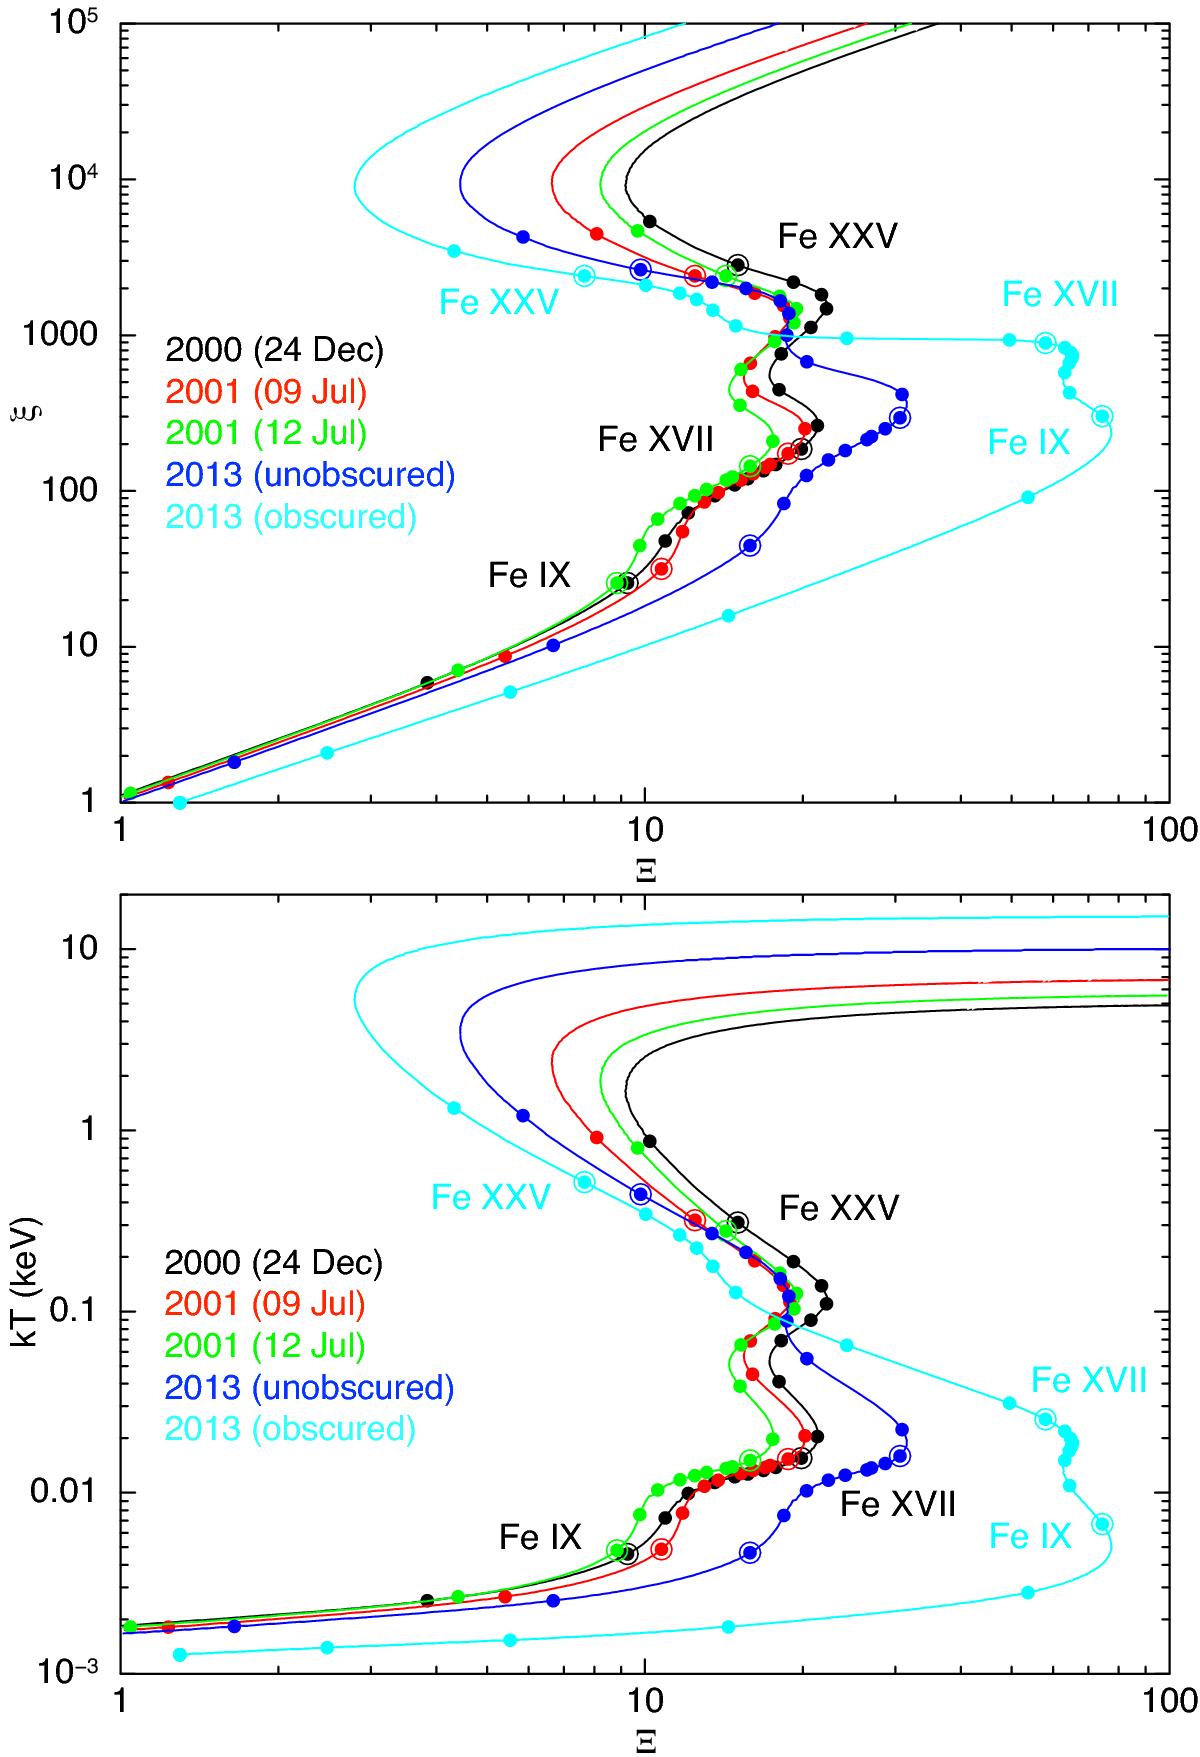
Thermal stability curves for photoionised gas in NGC 5548, showing ξ plotted versus Ξ (top panel) and temperature kT plotted versus Ξ (bottom panel). They have been calculated for SEDs (displayed in Figs. 11 and 12) derived from our broadband modelling of the continuum as described in Sect. 6. The circles on the stability curves indicate the positions at which ionic column densities of Fe peak on the (Ξ, ξ) and (Ξ, T) phase space. To guide the eye, the location of Fe ix, Fe xvii, Fe xxv have been indicated with open circles around filled circles.
Current usage metrics show cumulative count of Article Views (full-text article views including HTML views, PDF and ePub downloads, according to the available data) and Abstracts Views on Vision4Press platform.
Data correspond to usage on the plateform after 2015. The current usage metrics is available 48-96 hours after online publication and is updated daily on week days.
Initial download of the metrics may take a while.