Fig. 10
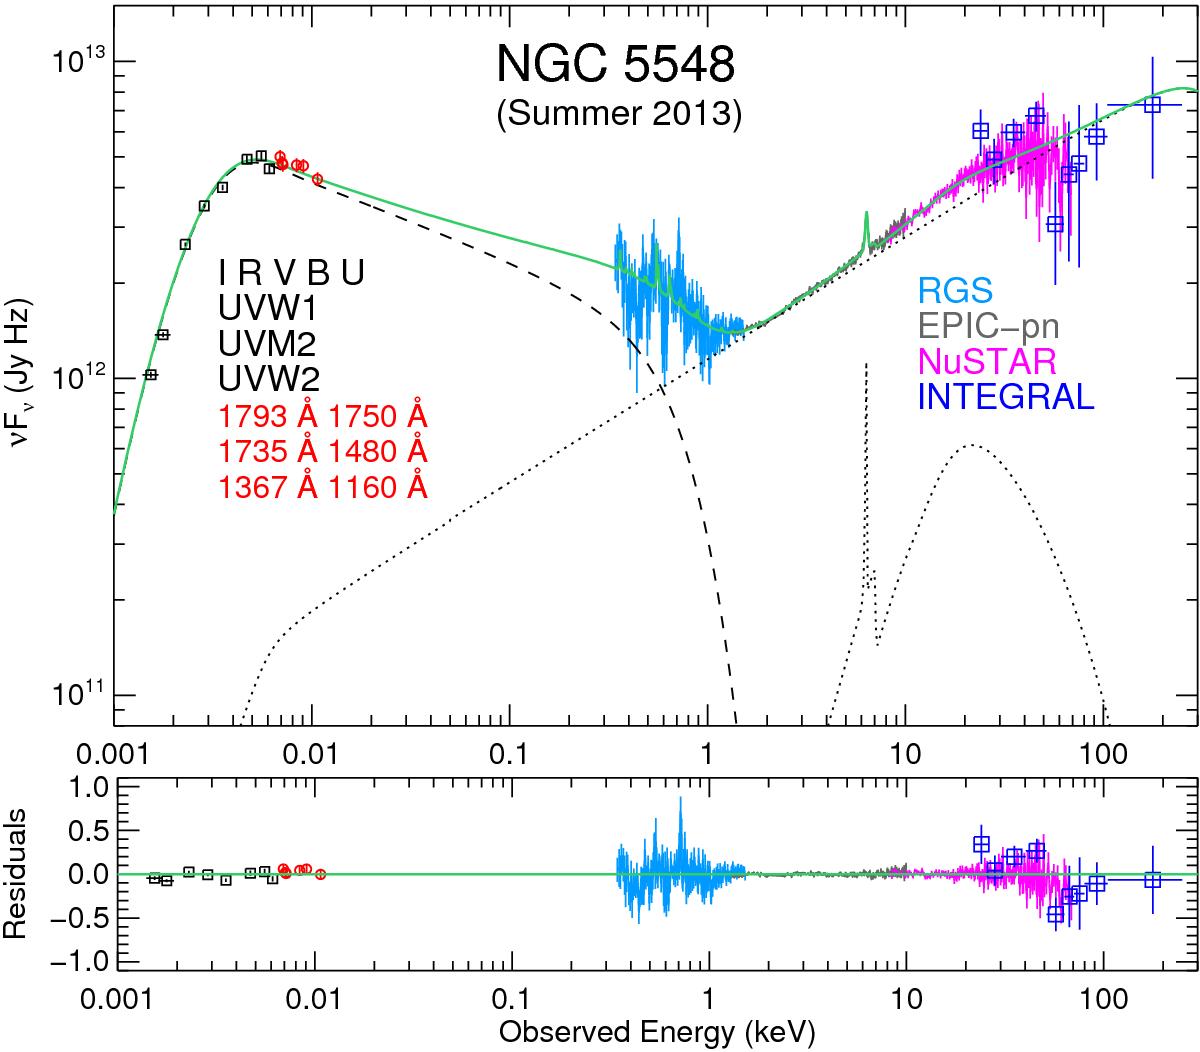
Best-fit broadband continuum model for the stacked summer 2013 data of NGC 5548 as described in Sect. 6. All the displayed data, labelled in the figure, have been corrected for the emission and absorption effects described in Sect. 4, including obscuration and warm absorption, required for determining the underlying continuum. The soft X-ray emission features seen in the RGS are shown on the continuum model for display purposes. The comt warm Comptonisation component (modelling the soft excess) is shown in black dashed-line, with the power-law (pow) and reflection (refl) components in black dotted-line form. The broadband model spectrum is represented in a solid green line. Residuals of the fit, defined as (data − model)/model, are displayed in the bottom panel.
Current usage metrics show cumulative count of Article Views (full-text article views including HTML views, PDF and ePub downloads, according to the available data) and Abstracts Views on Vision4Press platform.
Data correspond to usage on the plateform after 2015. The current usage metrics is available 48-96 hours after online publication and is updated daily on week days.
Initial download of the metrics may take a while.