Free Access
Fig. 1
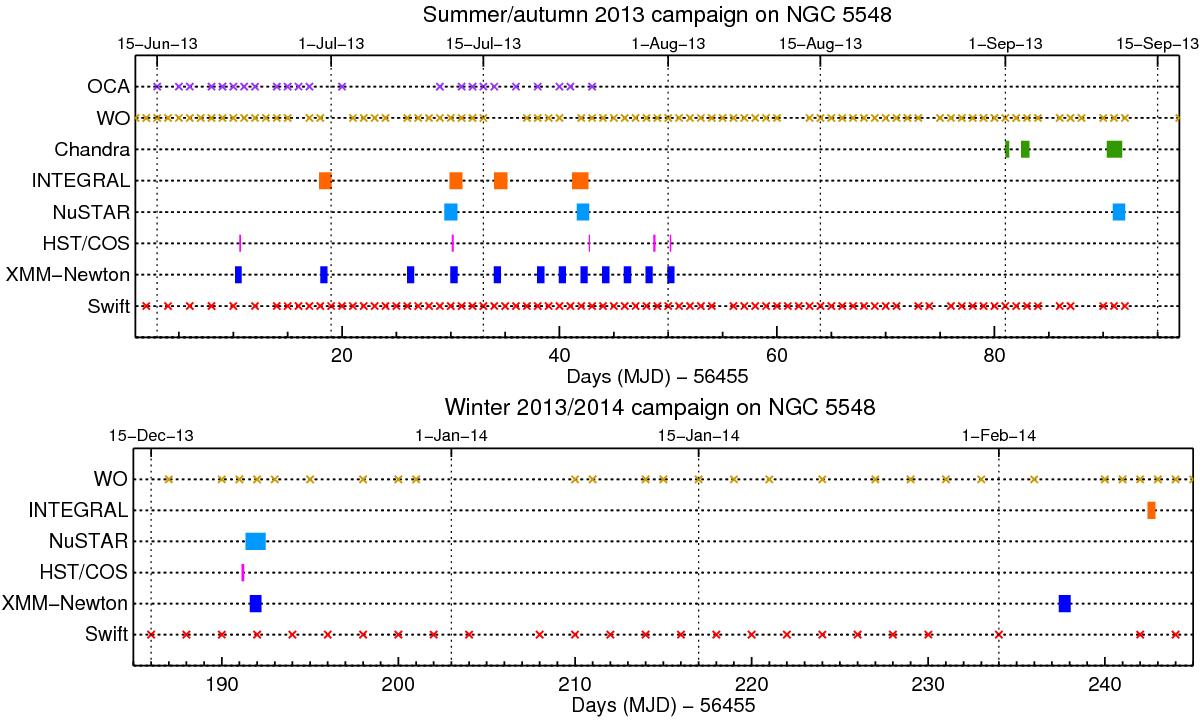
Timeline of our multi-wavelength campaign on NGC 5548. The thickness of each rectangular symbol on the time axis is indicative of the length of that observation. The days in which Swift, WO and OCA made observations are indicated by crosses.
This figure is made of several images, please see below:
Current usage metrics show cumulative count of Article Views (full-text article views including HTML views, PDF and ePub downloads, according to the available data) and Abstracts Views on Vision4Press platform.
Data correspond to usage on the plateform after 2015. The current usage metrics is available 48-96 hours after online publication and is updated daily on week days.
Initial download of the metrics may take a while.