Fig. 3
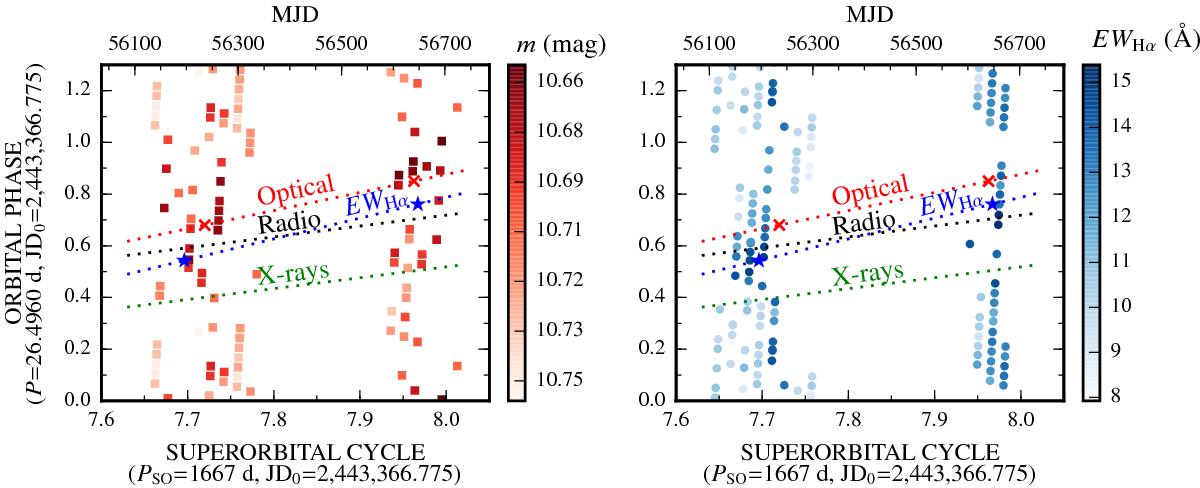
Color maps of the optical photometry (left) and EWHα (right) from LS I +61 303 as a function of the orbital phase and superorbital cycle. The red crosses and blue stars correspond to the phases of the maxima of the sinusoidal fits to the orbital variability of the optical photometry and EWHα, respectively, for the first and second seasons (see Table 3). The dotted color lines represent the orbital phase drift of the emission peaks caused by the superorbital variability for the optical photometry (red), EWHα (blue), radio (black), and X-rays (green). The radio and X-ray drifts are taken from Fig. 3 of Chernyakova et al. (2012) using data of the previous superorbital cycle.
Current usage metrics show cumulative count of Article Views (full-text article views including HTML views, PDF and ePub downloads, according to the available data) and Abstracts Views on Vision4Press platform.
Data correspond to usage on the plateform after 2015. The current usage metrics is available 48-96 hours after online publication and is updated daily on week days.
Initial download of the metrics may take a while.