Fig. 2
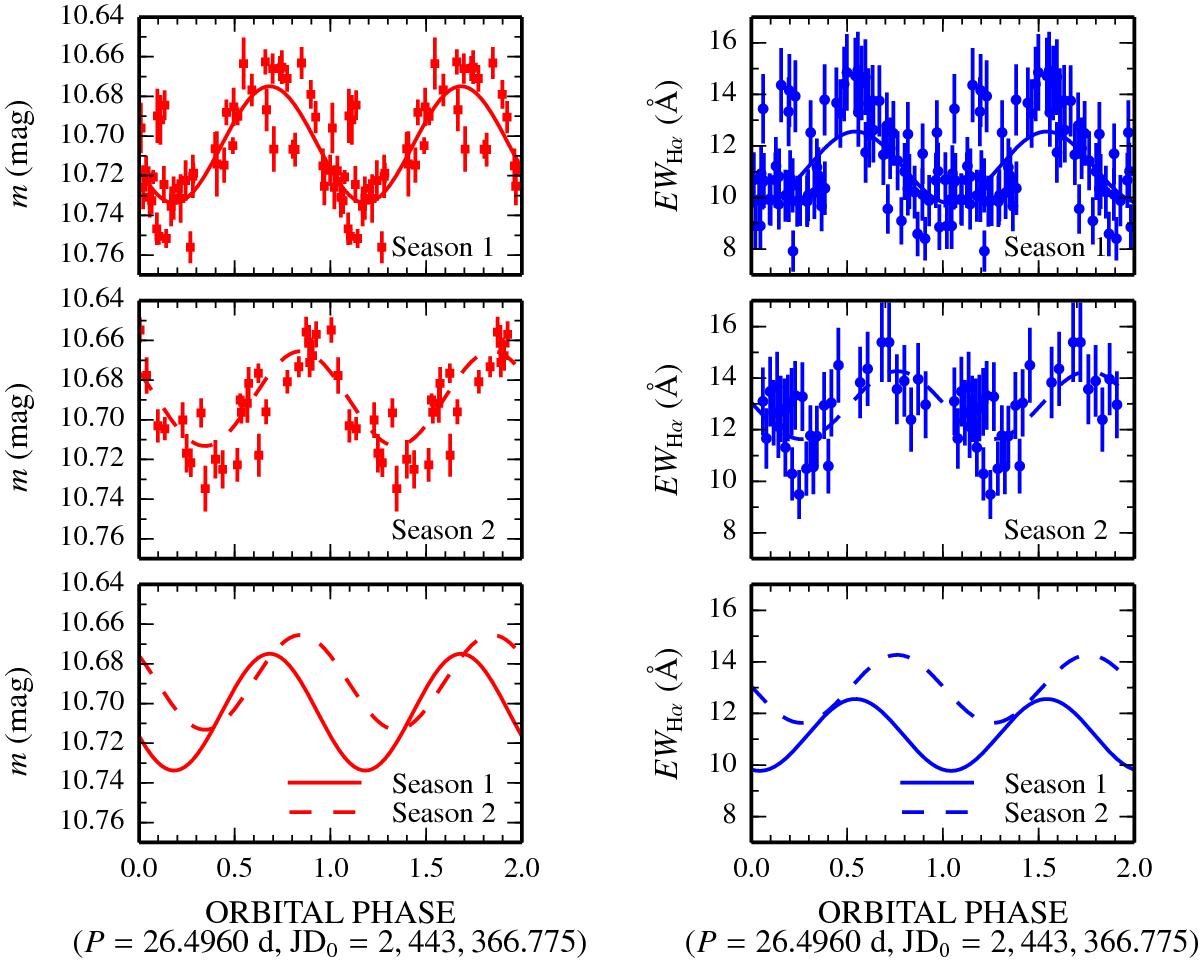
Optical photometric lightcurve (left, red) and EWHα (right, blue) of LS I +61 303 folded with the orbital phase for the first (top) and second (center) seasons, and their sinusoidal fits to the orbital variability (bottom; see Table 3). Error bars represent 1σ uncertainties. Two cycles are displayed for clarity. The shifts in the orbital modulations between both seasons are clear.
Current usage metrics show cumulative count of Article Views (full-text article views including HTML views, PDF and ePub downloads, according to the available data) and Abstracts Views on Vision4Press platform.
Data correspond to usage on the plateform after 2015. The current usage metrics is available 48-96 hours after online publication and is updated daily on week days.
Initial download of the metrics may take a while.