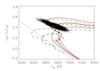
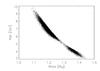
Fig. 4

Left panel: results of our MCMC analysis for HAT-P-13 in the Hertzsprung-Russell diagram. Black dots are individual steps in the Markov chain. The dotted line (blue) is the ZAMS. Solid lines (red) are isochrones for ages 6.6 ± 1.2 Gyr. Dashed lines (green) are evolutionary tracks for masses 1.21 ± 0.06 M⊙. All isochrones and tracks are for [ Fe/H ] i = 0.47. Right panel: joint posterior distribution for the mass and age and HAT-P-13 from our MCMC analysis.
Current usage metrics show cumulative count of Article Views (full-text article views including HTML views, PDF and ePub downloads, according to the available data) and Abstracts Views on Vision4Press platform.
Data correspond to usage on the plateform after 2015. The current usage metrics is available 48-96 hours after online publication and is updated daily on week days.
Initial download of the metrics may take a while.