Fig. 5
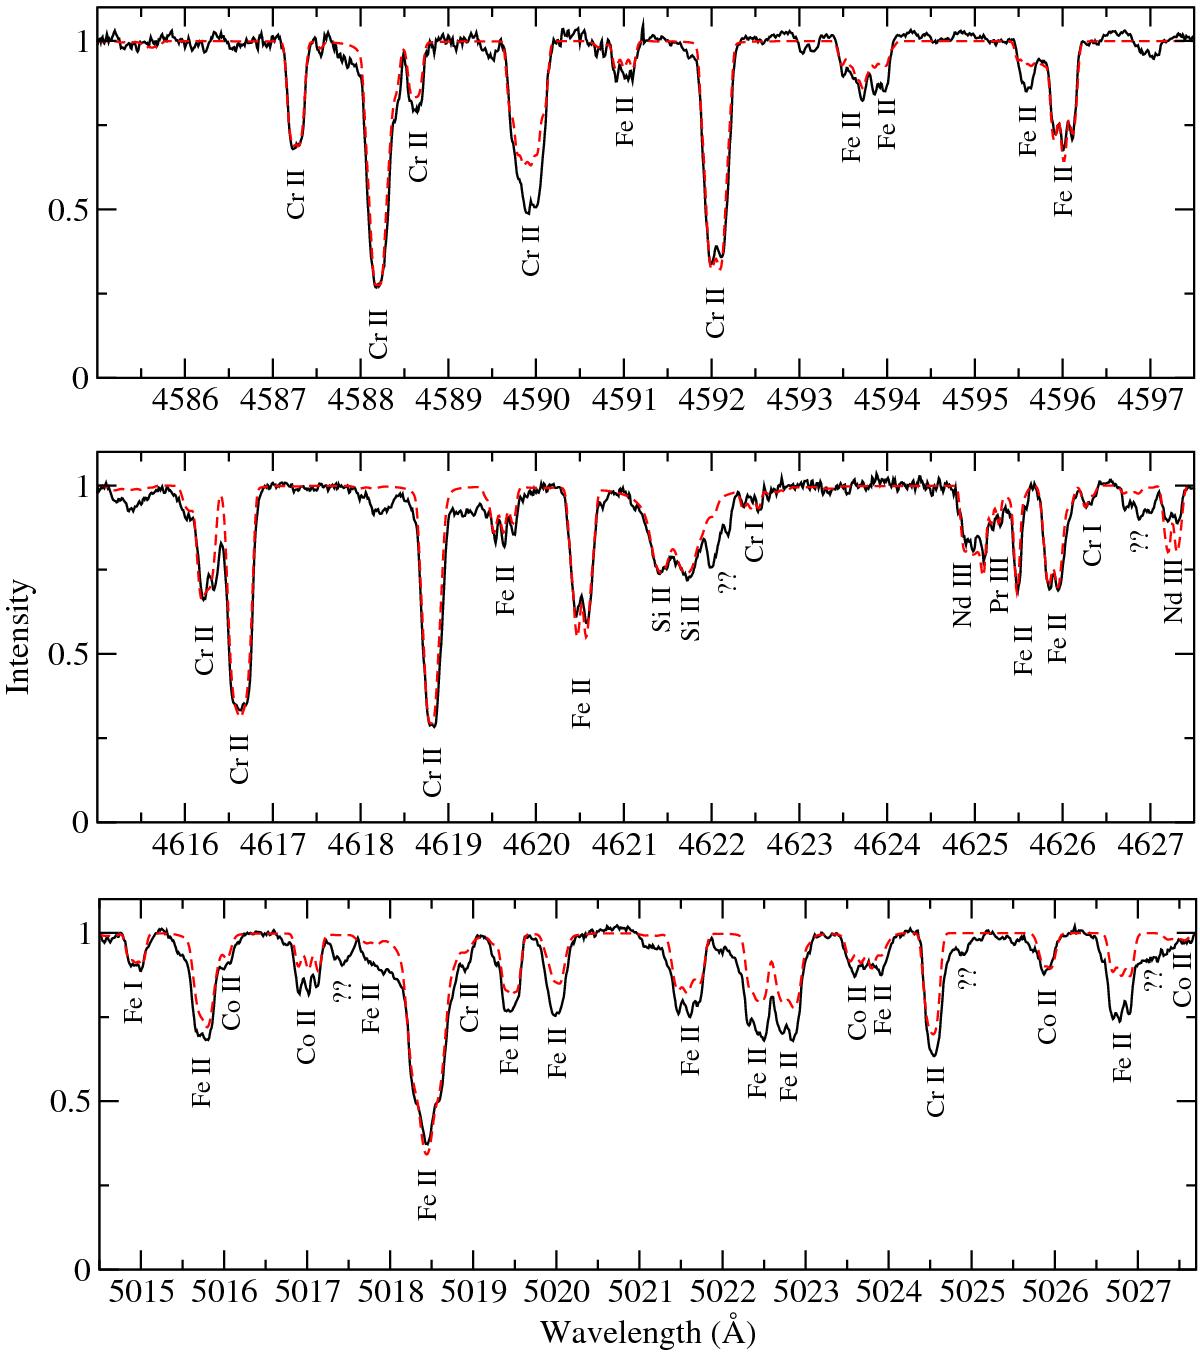
Example of three synthesised spectral windows for the 28-04-2014 HARPSpol spectrum of HD 94660. The observed spectrum is in black (solid line) and the model is in red (dashed line). The bottom panel illustrates the vertical stratification of Fe in the atmosphere of HD 94660, where strong lines of Fe ii and weak lines of Fe i are fit well with the abundance of Table 5, but the weaker lines of Fe ii require an enhanced abundance to be well modelled.
Current usage metrics show cumulative count of Article Views (full-text article views including HTML views, PDF and ePub downloads, according to the available data) and Abstracts Views on Vision4Press platform.
Data correspond to usage on the plateform after 2015. The current usage metrics is available 48-96 hours after online publication and is updated daily on week days.
Initial download of the metrics may take a while.