Fig. 2
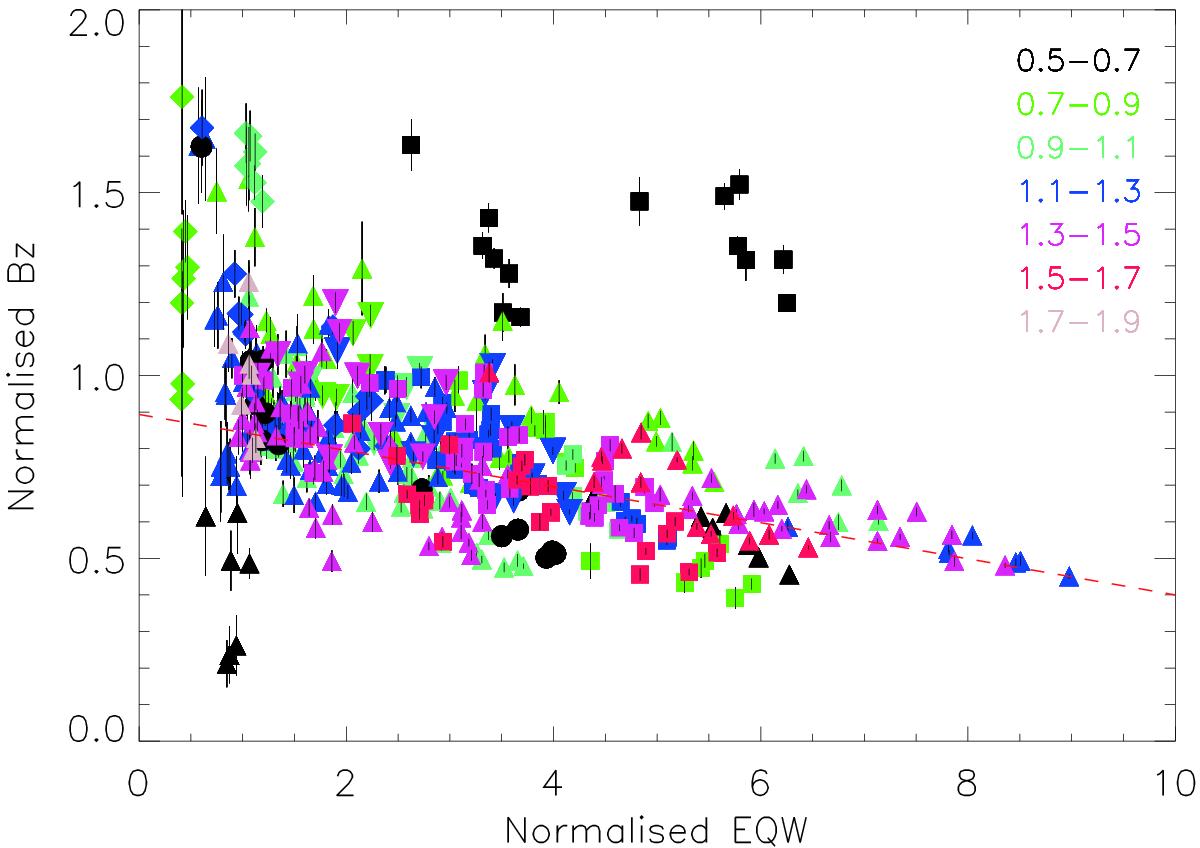
Variations in magnetic field strength ⟨ Bz ⟩ versus EQW for individual spectral lines. Different symbols denote different elements, while different colours are used to represent different Landé factor ranges. Note that the absolute value of the field strength is shown and each measurement has been normalised as discussed in the text. The dashed line is a linear fit to the data.
Current usage metrics show cumulative count of Article Views (full-text article views including HTML views, PDF and ePub downloads, according to the available data) and Abstracts Views on Vision4Press platform.
Data correspond to usage on the plateform after 2015. The current usage metrics is available 48-96 hours after online publication and is updated daily on week days.
Initial download of the metrics may take a while.