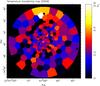
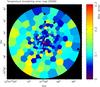
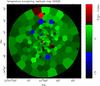
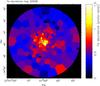
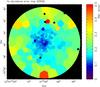
Fig. 8
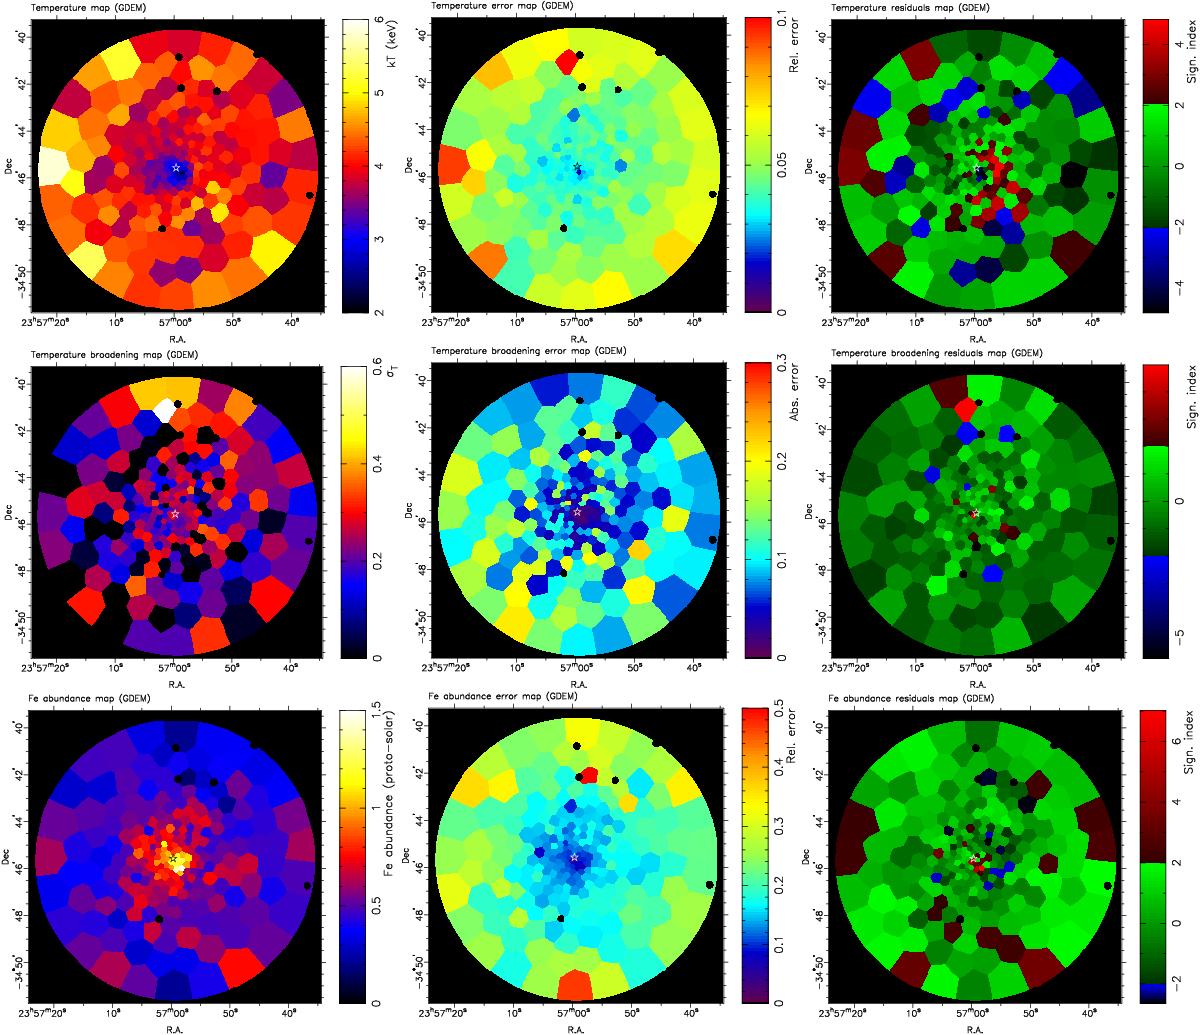
From upper to lower panels: kT, σT and Fe abundance maps of A 4059. The left panels show the basic maps (using a GDEM model). The middle panels show their corresponding absolute (ΔσT) or relative (ΔT/T; ΔFe/Fe) errors. Right panels: their corresponding residuals (see text). In the centre of each map, the (black or white) star shows the peak of X-ray emission. All the maps cover R ≤ 6 arcmin of FoV.
Current usage metrics show cumulative count of Article Views (full-text article views including HTML views, PDF and ePub downloads, according to the available data) and Abstracts Views on Vision4Press platform.
Data correspond to usage on the plateform after 2015. The current usage metrics is available 48-96 hours after online publication and is updated daily on week days.
Initial download of the metrics may take a while.