Free Access
Fig. 7
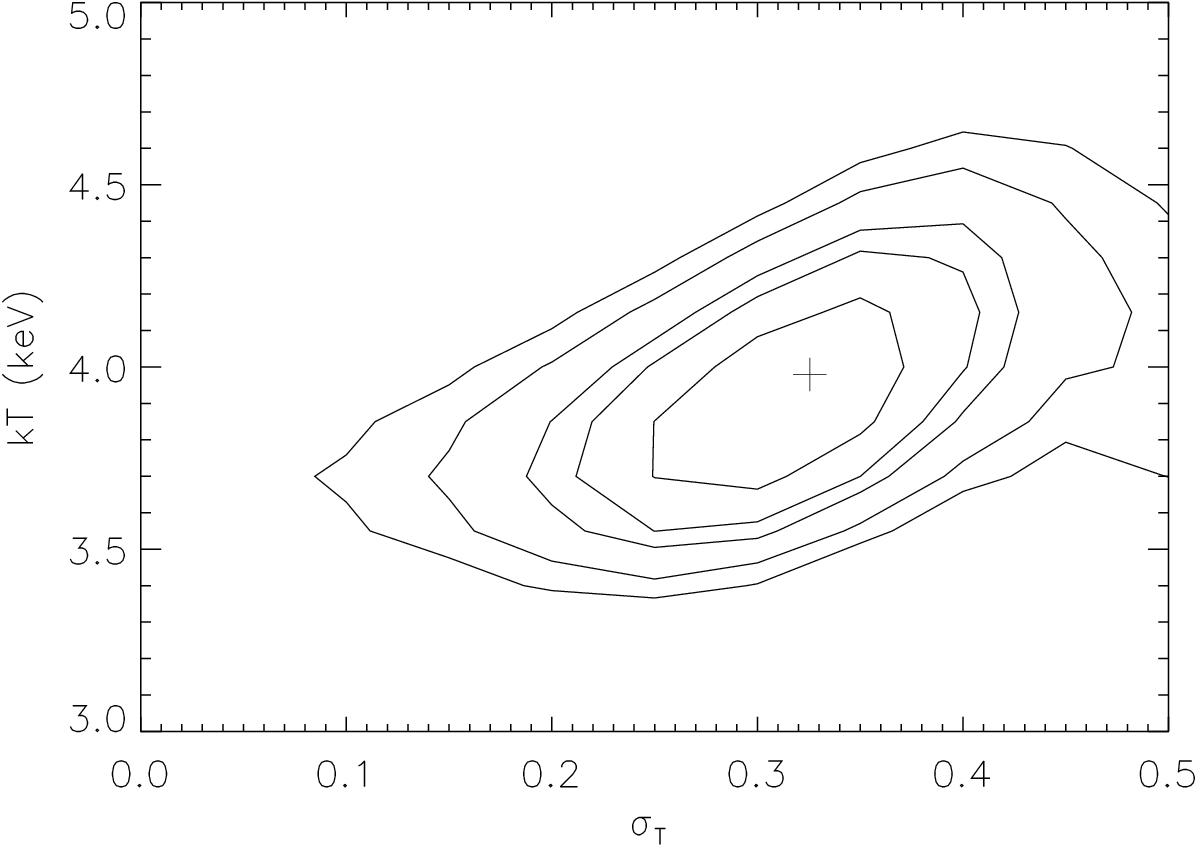
Error ellipses comparing the temperature kT with the broadening of the temperature distribution σT in the 9′–12′ annulus spectra. Contours are drawn for 1, 2, 3, 4, and 5σ. The “+” sign shows the best-fit value.
Current usage metrics show cumulative count of Article Views (full-text article views including HTML views, PDF and ePub downloads, according to the available data) and Abstracts Views on Vision4Press platform.
Data correspond to usage on the plateform after 2015. The current usage metrics is available 48-96 hours after online publication and is updated daily on week days.
Initial download of the metrics may take a while.