Free Access
Fig. B.1
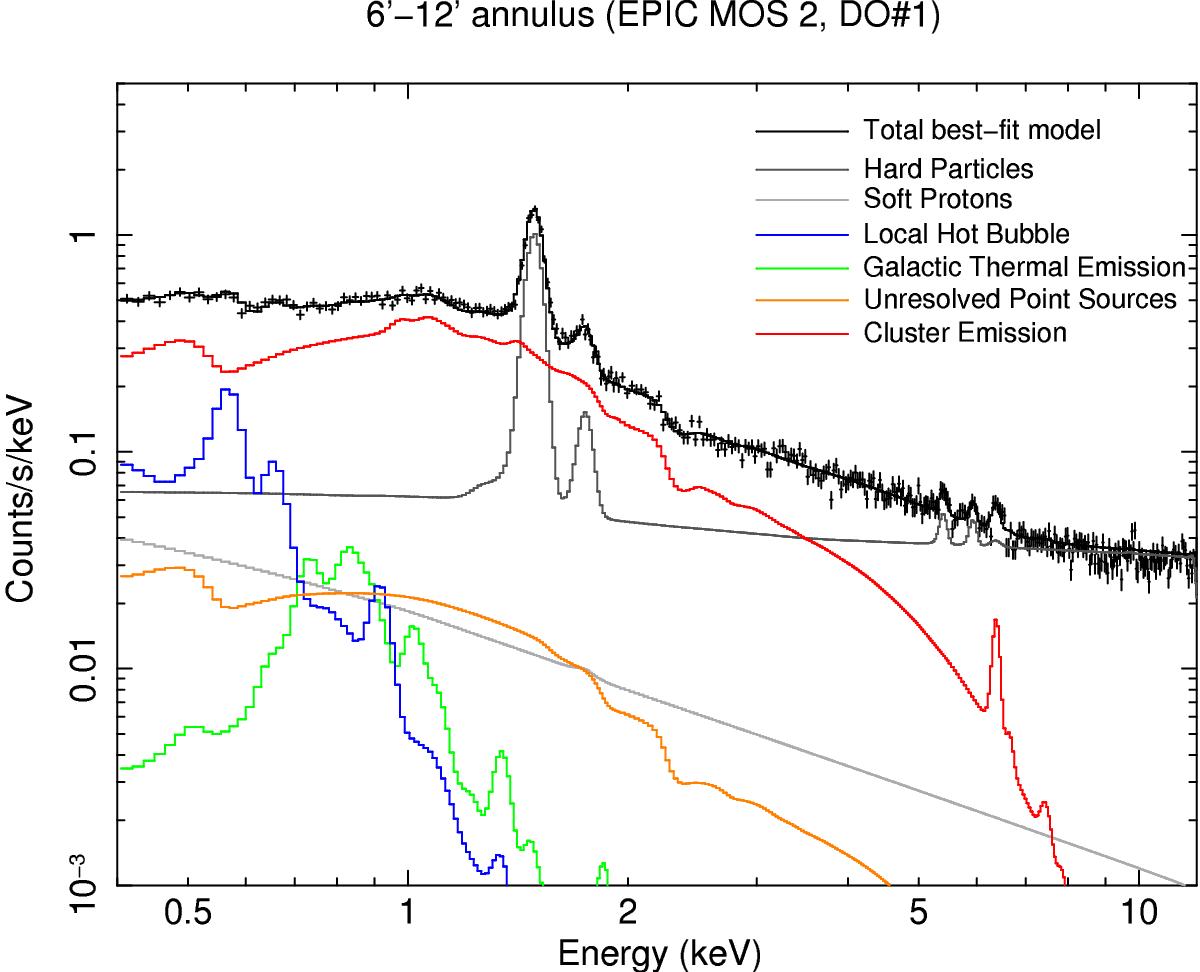
EPIC MOS2 spectrum of the 6′–12′ annular region around the core (see text). The solid black line represents the total best-fit model. Its individual modelled components (background and cluster emission, solid coloured lines) are also shown.
Current usage metrics show cumulative count of Article Views (full-text article views including HTML views, PDF and ePub downloads, according to the available data) and Abstracts Views on Vision4Press platform.
Data correspond to usage on the plateform after 2015. The current usage metrics is available 48-96 hours after online publication and is updated daily on week days.
Initial download of the metrics may take a while.