Fig. 1
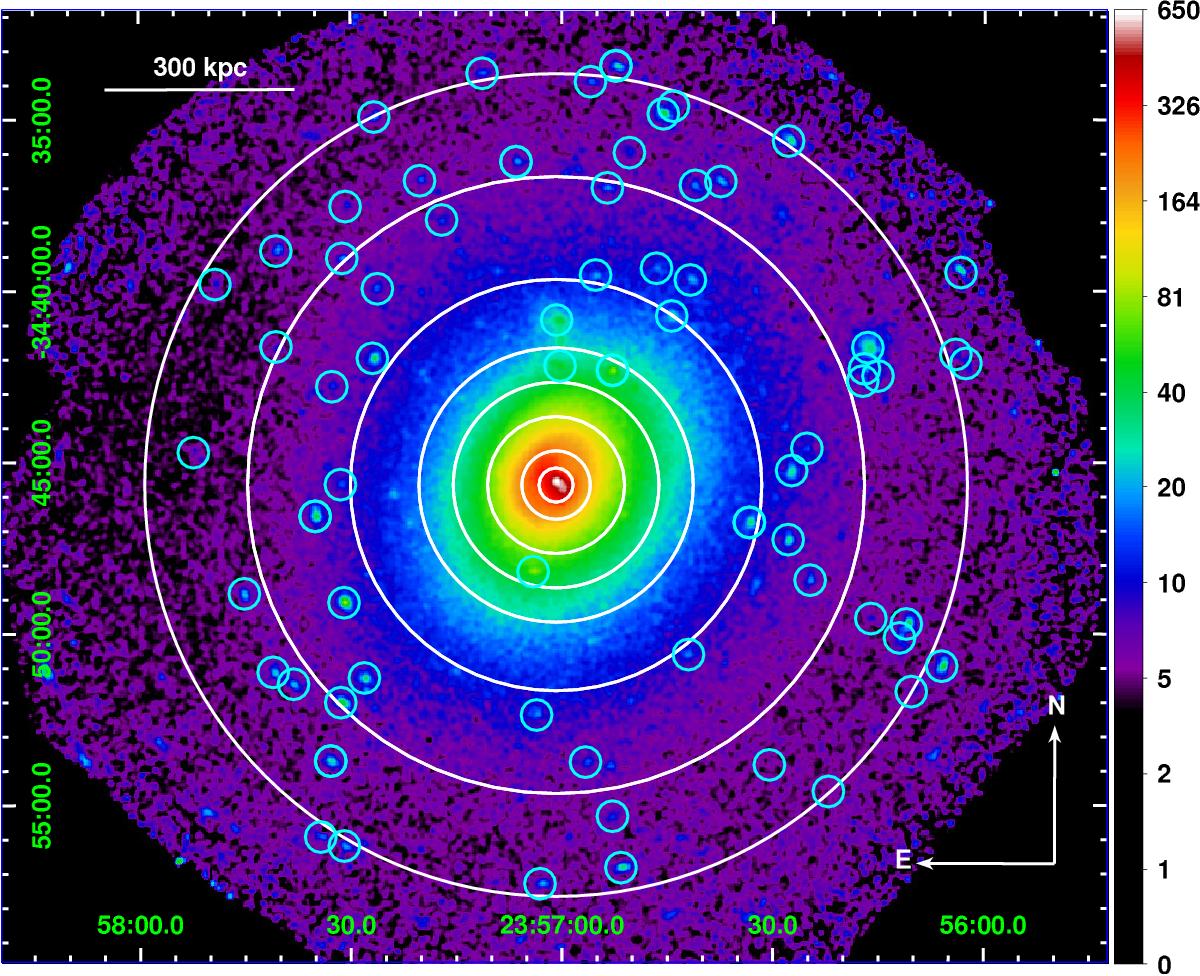
Exposure map corrected EPIC combined image of A 4059, in units of number of counts. The two datasets have been merged. The cyan circles show the detected resolved point sources that we excise from our analysis. For clarity of display the radii shown here are exaggerated (excision radius = 10′′, see Appendix A.2). The white annuli show the extraction regions that are used for our radial studies (see text and Sect. 5).
Current usage metrics show cumulative count of Article Views (full-text article views including HTML views, PDF and ePub downloads, according to the available data) and Abstracts Views on Vision4Press platform.
Data correspond to usage on the plateform after 2015. The current usage metrics is available 48-96 hours after online publication and is updated daily on week days.
Initial download of the metrics may take a while.