| Issue |
A&A
Volume 575, March 2015
|
|
|---|---|---|
| Article Number | A24 | |
| Number of page(s) | 7 | |
| Section | Catalogs and data | |
| DOI | https://doi.org/10.1051/0004-6361/201425281 | |
| Published online | 13 February 2015 | |
Research Note
The Hvar survey for roAp stars
II. Final results
1
Department of Theoretical Physics and AstrophysicsMasaryk
University,
Kotlářská 2,
611 37
Brno,
Czech Republic
e-mail:
epaunzen@physics.muni.cz
2
Institut für Astrophysik der Universität Wien,
Türkenschanzstr. 17,
1180
Wien,
Austria
3
Copernicus Astronomical Center, Bartycka 18, 00-716,
Warsaw,
Poland
4
Hvar Observatory, Faculty of Geodesy, University of
Zagreb, Kačićeva
26, 10000
Zagreb,
Croatia
Received: 5 November 2014
Accepted: 14 January 2015
Context. The 60 known rapidly oscillating Ap (roAp) stars are excellent laboratories to test pulsation models in the presence of stellar magnetic fields. Our survey is dedicated to search for new group members in the northern hemisphere.
Aims. We attempt to increase the number of known chemically peculiar stars that are known to be pulsationally unstable.
Methods. About 40 h of new CCD photometric data of 21 roAp candidates, observed at the 1 m Austrian-Croatian Telescope (Hvar Observatory) are presented. We carefully analysed these to search for pulsations in the frequency range of up to 10 mHz.
Results. No new roAp star was detected among the observed targets. The distribution of the upper limits for roAp-like variations is similar to that of previoius similar efforts using photomultipliers and comparable telescope sizes.
Conclusions. In addition to photometric observations, we need to consolidate spectroscopic information to select suitable targets.
Key words: stars: chemically peculiar / stars: variables: general
© ESO, 2015
1. Introduction
The rapidly oscillating Ap (roAp) stars can be found within an area of the pulsational instability in the Hertzsprung-Russell diagram, between the zero-age main-sequence and terminal-age main-sequence, ranging in effective temperature from about 6600 K to 8500 K. They are characterized by overabundances of up to several dex of, for example, strontium, chromium, europium, and other rare-earth elements when compared to the Sun. The roAp stars show pulsational periods in the range of about 5 to 25 min with amplitudes of up to 10 mmag in Johnson B.
Since their first detection by Kurtz (1982), about 60 stars of this type have been discovered. Almost all members of this group have been found with ground-based photometric observations of known classical chemically peculiar (CP) stars. With the new high-precision space-based data, several new low-amplitude roAp stars have been detected (Holdsworth et al. 2014, and references therein). In addition to this, some roAp stars have been discovered by spectral line variations of elements such as cerium, neodymium, and samarium (Elkin et al. 2011).
Most, but not all, of the roAp stars exhibit strong global magnetic fields with values of up to 25 kG (Hubrig et al. 2012). Therefore, these stars are excellent test cases for studying the interactions between magnetic fields and stellar pulsation. The driving mechanism of their oscillations is most probably the classical κ-mechanism operating in the hydrogen ionisation zone (Balmforth et al. 2001). Recently, Cunha et al. (2013) suggested another excitation mechanism, however, where the pulsations are driven by the turbulent pressure in the convection zone.
We initiated a photometric survey to search for northern roAp stars at the Hvar observatory (Paunzen et al. 2012,Paper I). Together with the new observations, we collected 100 h of time series in Bessell B for 41 individual targets. Observations of three targets (Renson 1860, 58275, and 58777) were presented in both papers, but Renson 59590 is misclassified as a CP star. This left us with 40 potential roAp candidates. The accuracy of our data is similar to those of former, similar, efforts (Joshi et al. 2006). We did not detect any new roAp star, but were able to establish upper limits for variability.
Basic data of the new target stars (upper panel), previously observed stars from Paper I (lower panel), and the results of the time-series analysis.
2. Target selection, observations, and reduction
All targets were selected from the catalogue of Ap, HgMn, and Am stars by Renson & Manfroid (2009). Although most known roAp stars are classified as SrCrEu, we widened our list of targets to also include hotter spectral types, that is, silicon stars, to avoid missing any variables due to a bias in the selection process. In total, we selected 21 further objects for observations.
All observations were performed at the Hvar Observatory, University of Zagreb, using the 1 m Austrian-Croatian Telescope (ACT) with the following equipment:
-
August, September, and October 2011: Apogee Alta U47 CCD camera, 1024 × 1024 pixels, a field of view of about 3′;
-
August 2014: Moravian instrument, G2-1600 KAF1603ME CCD camera, 1536 × 1024 pixels; a field of view, using a focal reducer, of about

The integration times for the observations in the Bessell B filter system were set to between 10 and 45 s, mainly depending on the brightness of the target and comparison stars as well as the seeing.
The data reduction and differential photometry were performed using the C-Munipack package1. If several comparison stars were available, these were checked individually to exclude variable objects. We compared the results of the final differential light curves using the aperture photometry routine from IRAF2. We found no differences above the photon noise.
The final light curves were examined in more detail using the program Period04 (Lenz & Breger 2005), which performs a discrete Fourier transformation. Significant peaks exceeding the noise level of more than 4σ with periods of more than one hour were subtracted. The results were checked with those from the phase-dispersion method computed within the program package Peranso3. No significant differences were noticed.
The detailed observational dates and results of the Fourier time-series analysis for all targets are listed in Table 1 and shown in Figs. 1 and 2.
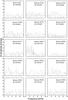 |
Fig. 1 Fourier spectra of target star light curves first investigated for roAp oscillations in this paper. |
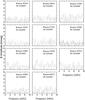 |
Fig. 1 continued. |
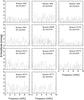 |
Fig. 2 Fourier spectra of the target star light curves previously investigated for roAp oscillations. |
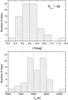 |
Fig. 3 Distributions of the brightness and effective temperature for the 40 investigated targets. |
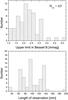 |
Fig. 4 Distributions of the upper limits for roAp-like variations and the length of observation for the 65 individual data sets. |
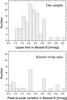 |
Fig. 5 Distributions of the upper limits for roAp-like variations from our sample and the peak-to-peak variation of known roAp stars from Kurtz et al. (2006). |
3. Analysis and discussion
Figure 3 shows the distributions of the apparent brightness and effective temperature for the 40 investigated targets. The effective temperatures were calibrated as described in Paper I. In short, they are mean values from different photometric calibrations and fitting the individual spectral energy distributions (SED). Almost all targets are between 8.5 and 10.5 mag in Johnson V. Taking into account the reddening values from Table 1 and corresponding isochrones (Bressan et al. 2012), a mean distance modulus of 8 mag (or a distance of 400 pc) places all targets between the zero- and terminal-age main-sequence. The range of effective temperatures is broader than the values of known roAp stars.
The distributions of the upper limits for roAp-like variations and the length of observation for the 65 individual data sets (about 100 h, in total) are shown in Fig. 4. We can directly compare them with those of the null-results from the Nainital-Cape survey Joshi et al. (2006, Fig. 7 therein). They used a Johnson B filter, a photoelectric detector, and a 1.04 m telescope for their photometric time-series observations. The upper limits range from 0.3 to 5.3 mmag with a peak at about 1.3 mmag. The peak of our distribution is shifted by about 1 mmag to higher values. This is probably caused by the lower quantum efficiencies of the CCDs compared to the photomultiplier at the same integration time (limited by the sufficient coverage of the highest known roAp pulsation frequency) and telescope size. In addition, the observations were performed at a much higher altitude (about 2000 m, while Hvar observatory is at 238 m above the sea level), which results in a lower scintillation noise. The length of observations guarantee that at least three full pulsation cycles are covered, taking into account the longest known pulsation period of 23.5 min of the roAp star HD 60435 (Kurtz et al. 2006).
We compared the results of the time series limits with the distribution of the peak-to-peak variations of known roAp stars from Kurtz et al. (2006). The latter are also for B magnitudes. Additional later detected roAp stars were either found spectroscopically (e.g., Kochukhov et al. 2013) or are low-amplitude stars in a different filter (e.g., Holdsworth et al. 2014). No attempt was made to transfer amplitudes from other photometric systems to B magnitudes. Figure 5 shows the comparison of both distributions. Nine known roAp stars exceed a peak-to-peak variation of 5 mmag. Therefore, we conclude that there might be bona-fide roAp stars among our sample that were not detected because of their low photometric amplitudes (several members do not even show photometric variation at all).
In the following, we discuss the results for some individual stars in more detail.
Renson 1860 and 58275: results for both stars were presented in Paper I. We re-observed them on four nights, each, to investigate their long-term (in)stability. Balona et al. (2013) showed that the amplitudes of the individual frequencies can vary significantly over time also with the rotational phase, for example. In our case, this would mean that we miss possible statistically significant amplitudes. However, we were unable to find a positive detection.
Renson 45762 and 45763: both stars are located in the area of the open cluster IC 4665 (age about 40 Myr). According to Zejda et al. (2012), the mean proper motion of IC 4665 is, based on five individual references, μαcosδ = −0.8 ± 0.2 mas yr-1 and μδ = −8.3 ± 0.1 mas yr-1, respectively. The proper motions of the targets are [+22.8±1.8, −4.6±1.7] and [+ 1.9 ± 1.9, + 8.9 ± 1.9] taken from the Tycho-2 catalogue (Høg et al. 2000). We conclude that neither star is a member of IC 4665.
Renson 49170: Renson & Manfroid (2009) gave an incorrect identification (BD+27 3185), the correct one is BD+27 3184.
Renson 49830: for this object, we analysed eight different data sets because the first one showed a very high noise level (about 4 mmag) in the interesting frequency domain. In the consecutive observations, the upper limits range from 1.3 to 3.2 mmag. In none of these observations did we find a statistically significant peak.
Renson 52200: in Simbad/CDS the reference for “Renson 52200” is incorrect. It is linked to the star HD 339199, but with incorrect coordinates, as also given by Renson & Manfroid (2009). The correct star, which appears brighter and bluer, is about one arcminute away and currently listed as HD 399199 in Simbad. This ID is most likely a typographical error in Simbad/CDS, because the number exceeds the entries in the HD catalogues. The star is actually HD 339199 according to the catalogue by Fabricius et al. (2002), for example.
Renson 54800: this is a very interesting close binary system (separation of about 3″) consisting of a CP1 and a CP2 star (Abt & Cardona 1984), for which Cowley & Cowley (1964) reported possible spectrum variability. The two components were not resolved, therefore our observations are for the combined flux.
Renson 58777: in Paper I, we stated that this is a good candidate for follow-up observations. Here, we present one additional data set (Fig. 2). No statistically significant variability with an upper limit of 2.9 mmag was detected. However, this limit is just 0.1 mmag lower than previously. Therefore, this star is still worthy of further follow-up observations.
Renson 59590: from the available photometry we conclude that this object is an early G-type dwarf. But it was classified as “A7 Sr” by Zirin (1951). He listed a photographic magnitude of 8.5 mag, while B/V is 12.09/11.12 mag, respectively. We checked some other listed magnitudes and compared them to more recent magnitudes for stars with similar spectral types (for example, HD 188854) and found an excellent agreement. In the vicinity of Renson 59590, there are no other bright stars of eigth to ninth magnitude, however. We conclude that there is probably a typographical error of the stellar designation in Zirin (1951). This object is certainly no CP star.
Renson 59980: the star is located in the area of the Cep OB3 association, but very probably a nonmember based on kinematic and photometric data (Kharchenko et al. 2004). The reddening of the star is lower than that of other members of the association (e.g., Garrison 1970), which confirms this classification.
4. Conclusions
We presented our efforts to search new northern roAp stars in two papers. In total, 65 individual data sets with about 100 h of CCD photometry for 40 stars were analysed without detecting a statistically significant signal. The upper limits for the variability range are between 1 to 5 mmag with a peak at about 2 mmag.
Further high-precision photometric observations are needed to detect new roAp stars to initiate spectroscopic follow-up observations to model their stellar atmospheres in more detail (Nesvacil et al. 2013). As a first step, however, the only source for good candidate targets, the catalogue by Renson & Manfroid (2009), has to be consolidated and updated. In addition, even for bright stars, we lack modern classification resolution spectroscopy (Paunzen et al. 2011). We will continue our efforts to contribute to these different tasks in the future.
Available from http://iraf.noao.edu/
Acknowledgments
This project is financed by the SoMoPro II programme (3SGA5916). The research leading to these results has acquired a financial grant from the People Programme (Marie Curie action) of the Seventh Framework Programme of EU according to the REA Grant Agreement No. 291782. The research is further co-financed by the South-Moravian Region. It was also supported by the grants GP14-26115P, 7AMB14AT015, the financial contributions of the Austrian Agency for International Cooperation in Education and Research (BG-03/2013 and CZ-09/2014). G.H. is grateful for support by the Polish NCN grant 2011/01/B/ST9/05448. H.B. acknowledges financial support by Croatian Science Foundation under the project 6212 “Solar and Stellar Variability”. This research has made use of the WEBDA database, operated at the Department of Theoretical Physics and Astrophysics of the Masaryk University. This work reflects only the authors’ views, and the European Union is not liable for any use that may be made of the information contained therein.
References
- Abt, H. A., & Cardona, O. 1984, ApJ, 276, 266 [NASA ADS] [CrossRef] [Google Scholar]
- Balmforth, N. J., Cunha, M. S., Dolez, N., Gough, D. O., & Vauclair, S. 2001, MNRAS, 323, 362 [NASA ADS] [CrossRef] [Google Scholar]
- Balona, L. A., Catanzaro, G., Crause, L., et al. 2013, MNRAS, 432, 2808 [NASA ADS] [CrossRef] [Google Scholar]
- Bressan, A., Marigo, P., Girardi, L., et al. 2012, MNRAS, 427, 127 [NASA ADS] [CrossRef] [Google Scholar]
- Cowley, A. P., & Cowley, C. R. 1964, PASP, 76, 119 [NASA ADS] [CrossRef] [Google Scholar]
- Cunha, M. S., Alentiev, D., Brandão, I. M., & Perraut, K. 2013, MNRAS, 436, 1639 [NASA ADS] [CrossRef] [Google Scholar]
- Elkin, V. G., Kurtz, D. W., Worters, H. L., et al. 2011, MNRAS, 411, 978 [NASA ADS] [CrossRef] [Google Scholar]
- Fabricius, C., Makarov, V. V., Knude, J., & Wycoff, G. L. 2002, A&A, 386, 709 [NASA ADS] [CrossRef] [EDP Sciences] [Google Scholar]
- Garrison, R. F. 1970, AJ, 75, 1001 [NASA ADS] [CrossRef] [Google Scholar]
- Høg, E., Fabricius, C., Makarov, V. V., et al. 2000, A&A, 355, L27 [NASA ADS] [Google Scholar]
- Holdsworth, D. L., Smalley, B., Kurtz, D. W., et al. 2014, MNRAS, 443, 2049 [NASA ADS] [CrossRef] [Google Scholar]
- Hubrig, S., Kurtz, D. W., Schöller, M., et al. 2012, ASP Conf. Ser., 462, 318 [Google Scholar]
- Joshi, S., Mary, D. L., Martinez, P., et al. 2006, A&A, 455, 303 [NASA ADS] [CrossRef] [EDP Sciences] [Google Scholar]
- Kharchenko, N. V., Piskunov, A. E., Röser, S., Schilbach, E., & Scholz, R.-D. 2004, Astron. Nachr., 325, 740 [NASA ADS] [CrossRef] [Google Scholar]
- Kochukhov, O., Alentiev, D., Ryabchikova, T., et al. 2013, MNRAS, 431, 2808 [NASA ADS] [CrossRef] [Google Scholar]
- Kurtz, D. W. 1982, MNRAS, 200, 807 [NASA ADS] [CrossRef] [Google Scholar]
- Kurtz, D. W., Elkin, V. G., Cunha, M. S., et al. 2006, MNRAS, 372, 286 [NASA ADS] [CrossRef] [Google Scholar]
- Lenz, P., & Breger, M. 2005, Commun. Asteroseismol., 146, 53 [NASA ADS] [CrossRef] [Google Scholar]
- Nesvacil, N., Shulyak, D., Ryabchikova, T. A., et al. 2013, A&A, 552, A28 [NASA ADS] [CrossRef] [EDP Sciences] [Google Scholar]
- Paunzen, E., Netopil, M., Pintado, O. I., & Rode-Paunzen, M. 2011, Astron. Nachr., 332, 77 [NASA ADS] [CrossRef] [Google Scholar]
- Paunzen, E., Netopil, M., Rode-Paunzen, M., et al. 2012, A&A, 542, A89 (Paper I) [NASA ADS] [CrossRef] [EDP Sciences] [Google Scholar]
- Renson, P., & Manfroid, J. 2009, A&A, 498, 961 [NASA ADS] [CrossRef] [EDP Sciences] [Google Scholar]
- Zejda, M., Paunzen, E., Baumann, B., Mikulášek, Z., & Liška, J. 2012, A&A, 548, A97 [CrossRef] [EDP Sciences] [Google Scholar]
- Zirin, H. 1951, Harvard College Observatory Bulletin No. 920, 38 [Google Scholar]
All Tables
Basic data of the new target stars (upper panel), previously observed stars from Paper I (lower panel), and the results of the time-series analysis.
All Figures
|
Fig. 1 Fourier spectra of target star light curves first investigated for roAp oscillations in this paper. |
| In the text | |
|
Fig. 1 continued. |
| In the text | |
|
Fig. 2 Fourier spectra of the target star light curves previously investigated for roAp oscillations. |
| In the text | |
|
Fig. 3 Distributions of the brightness and effective temperature for the 40 investigated targets. |
| In the text | |
|
Fig. 4 Distributions of the upper limits for roAp-like variations and the length of observation for the 65 individual data sets. |
| In the text | |
|
Fig. 5 Distributions of the upper limits for roAp-like variations from our sample and the peak-to-peak variation of known roAp stars from Kurtz et al. (2006). |
| In the text | |
Current usage metrics show cumulative count of Article Views (full-text article views including HTML views, PDF and ePub downloads, according to the available data) and Abstracts Views on Vision4Press platform.
Data correspond to usage on the plateform after 2015. The current usage metrics is available 48-96 hours after online publication and is updated daily on week days.
Initial download of the metrics may take a while.