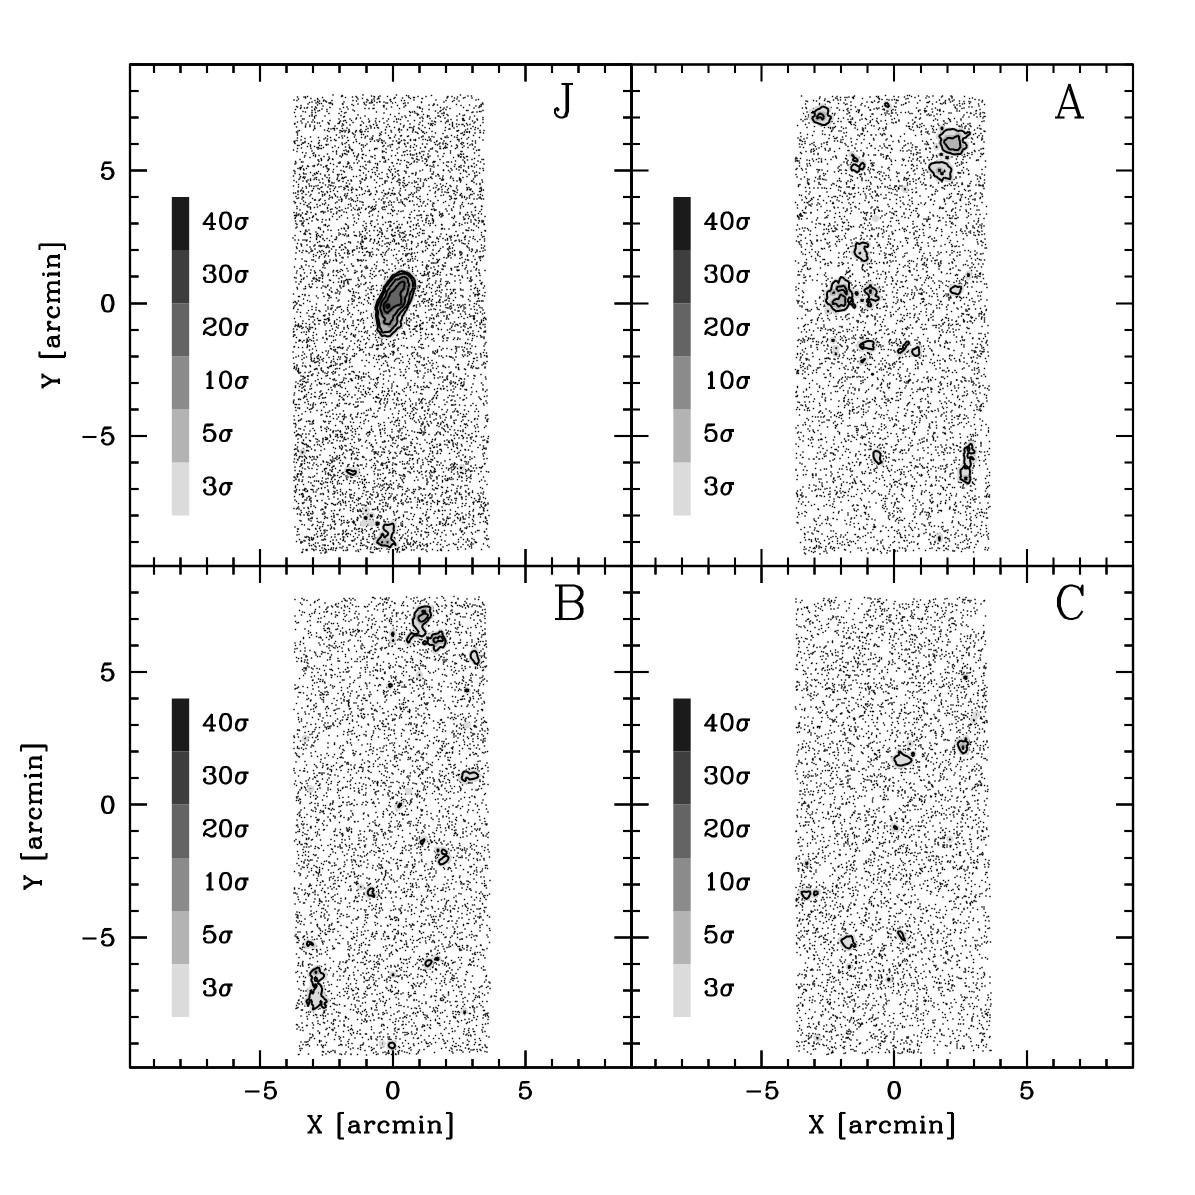
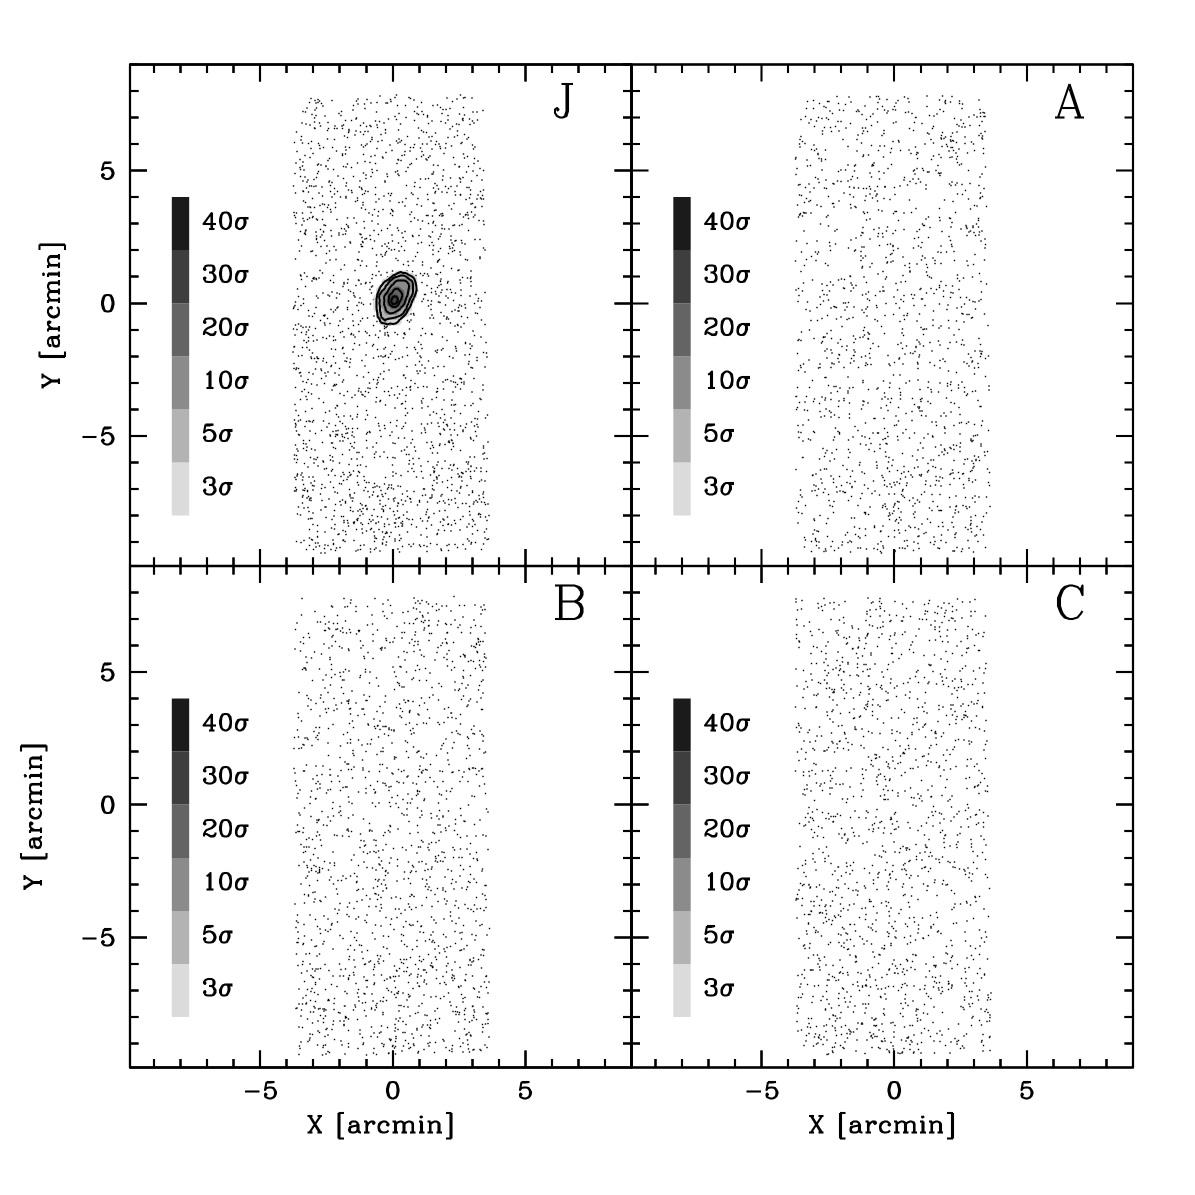
Fig. 9
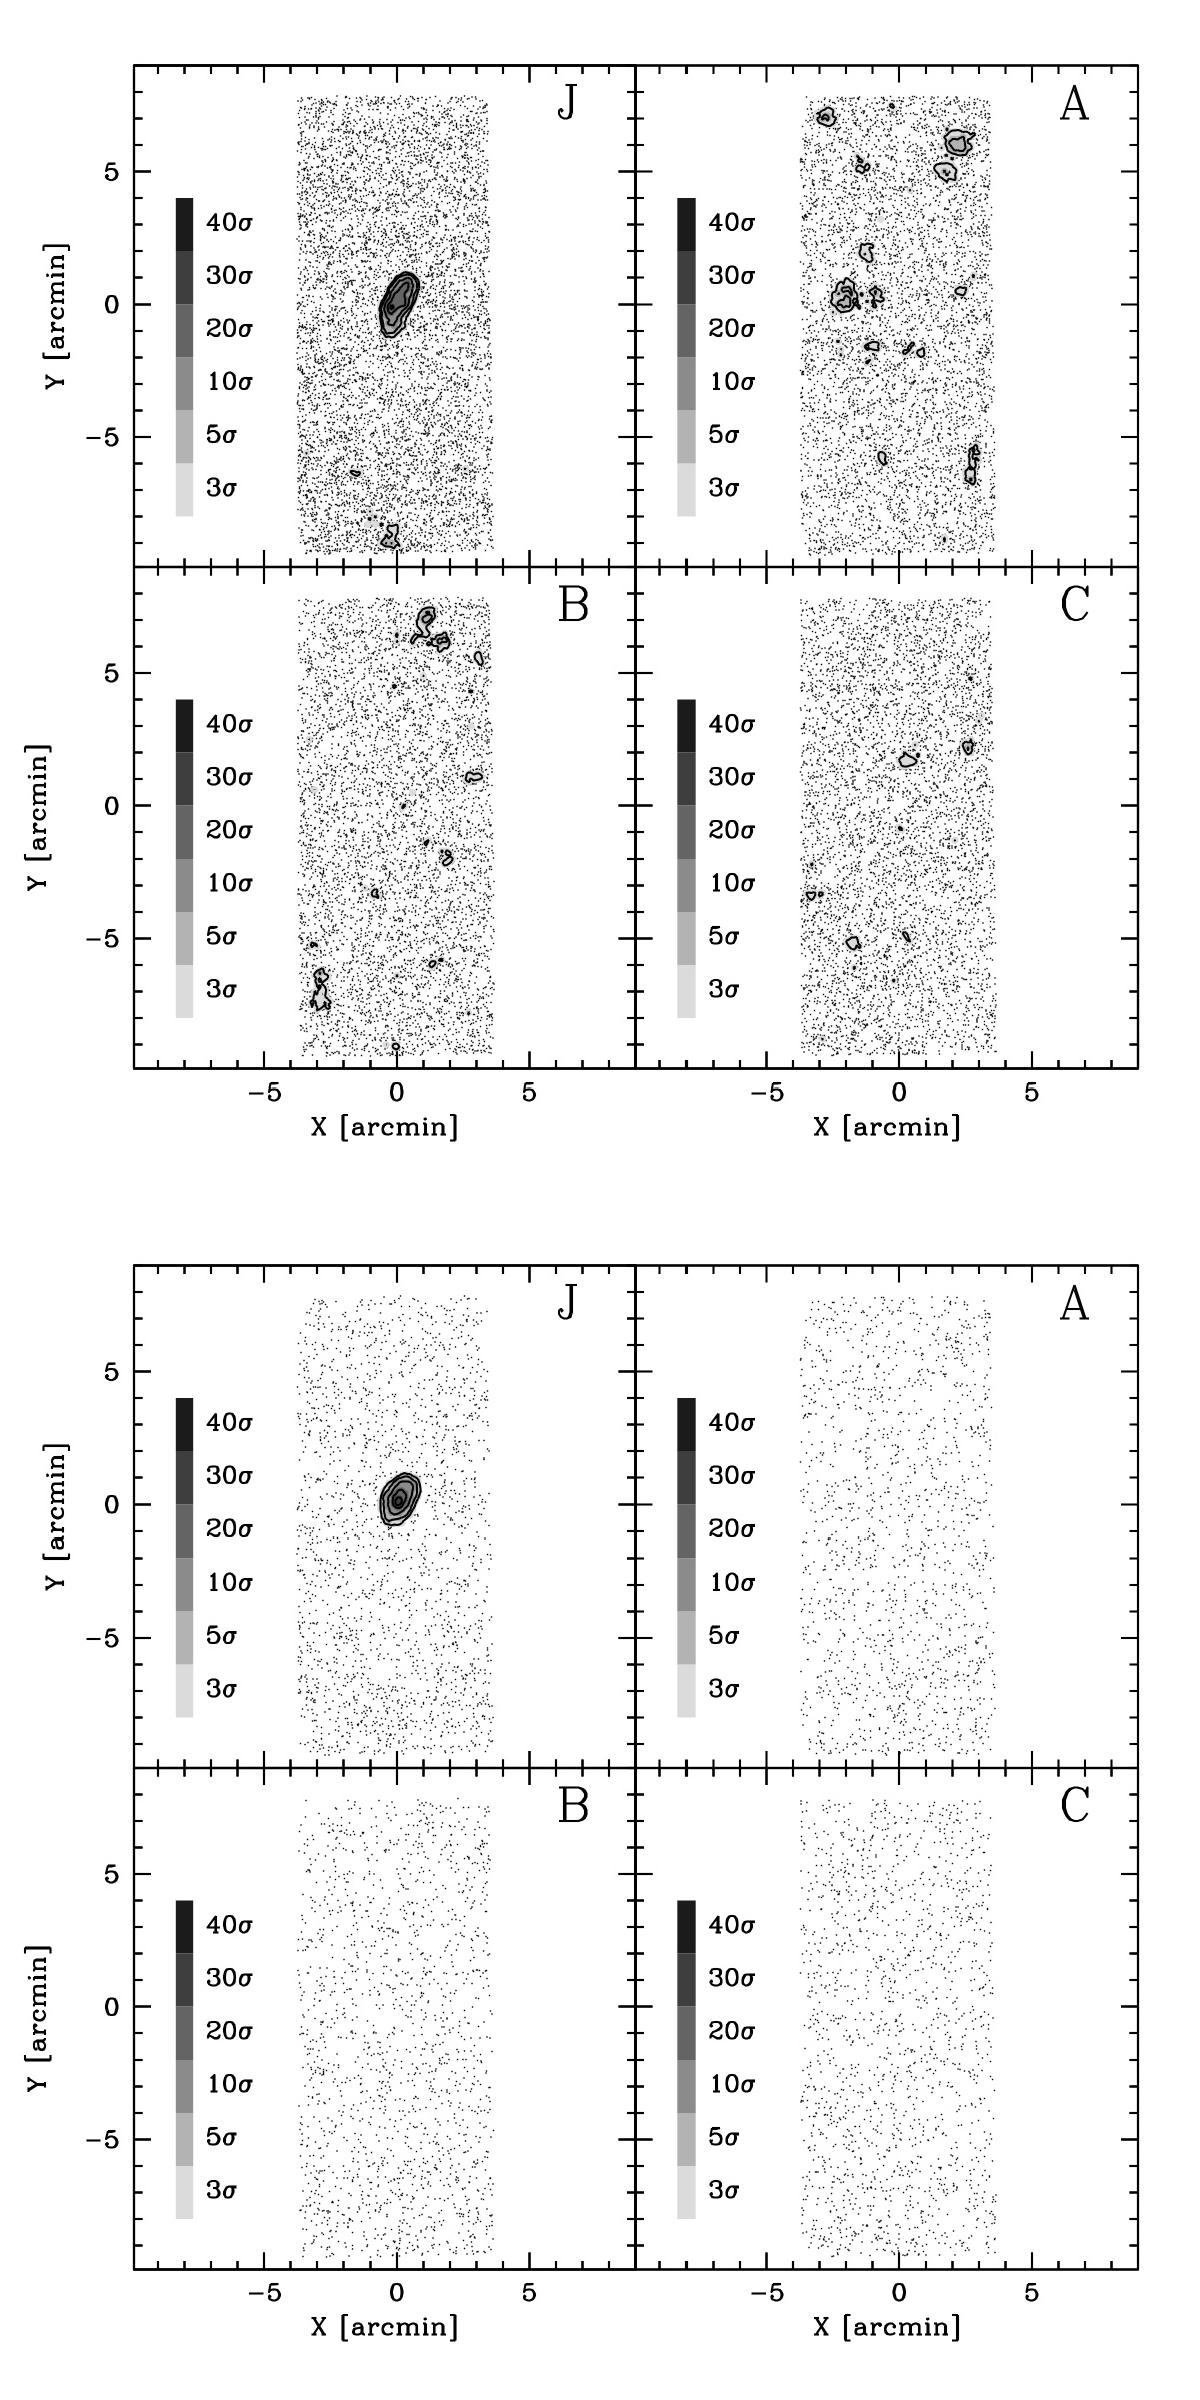
Upper array of four panels: r27 surface density maps for fields J (including Leo P), A, B, and C. Dots correspond to the sources used to compute the density maps. Surface density levels are expressed in units of σbkg above the background in different tones of grey, from the lightest (ρ ≥ 3.0σbkg to the darkest ρ ≥ 40.0σbkg, as illustrated by the vertical greyscale bar. Lower array of four panels: same for the r25 maps.
Current usage metrics show cumulative count of Article Views (full-text article views including HTML views, PDF and ePub downloads, according to the available data) and Abstracts Views on Vision4Press platform.
Data correspond to usage on the plateform after 2015. The current usage metrics is available 48-96 hours after online publication and is updated daily on week days.
Initial download of the metrics may take a while.