Fig. 6
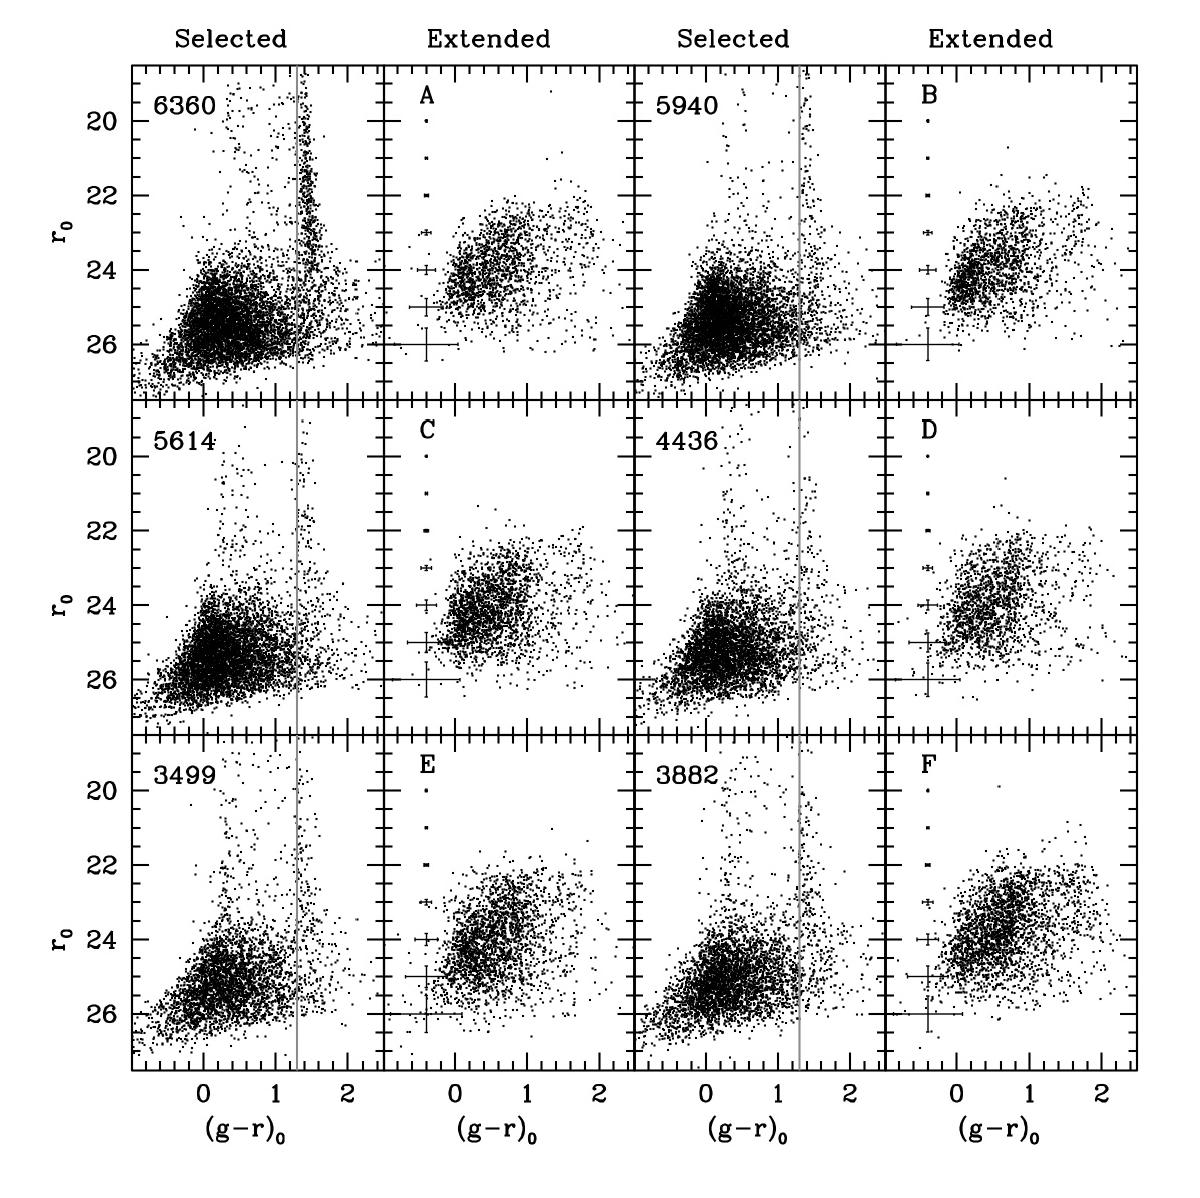
Reddening-corrected CMDs of six fields. For each field we present the CMD of the sources selected according to their CHI and SHARP parameters (left panels of each pair; “Selected” columns of the array of panels) and the CMD of those sources that are excluded from the selection because of their SHARP value larger which is higher than the (positive) limit; i.e., they are recognised by DAOPHOT as more extended than point sources (right panels of each couple; “Extended” columns of the array of panels). The grey line in the CMDs of selected sources marks the colour threshold adopted to exclude local M dwarfs from the computation of density maps. The error bars are the average photometric errors in colour and magnitude as a function of magnitude, for Selected sources, computed over one magnitude wide bins. The number of Selected sources is also reported in the upper left corner of the respective CMD.
Current usage metrics show cumulative count of Article Views (full-text article views including HTML views, PDF and ePub downloads, according to the available data) and Abstracts Views on Vision4Press platform.
Data correspond to usage on the plateform after 2015. The current usage metrics is available 48-96 hours after online publication and is updated daily on week days.
Initial download of the metrics may take a while.