Fig. 4
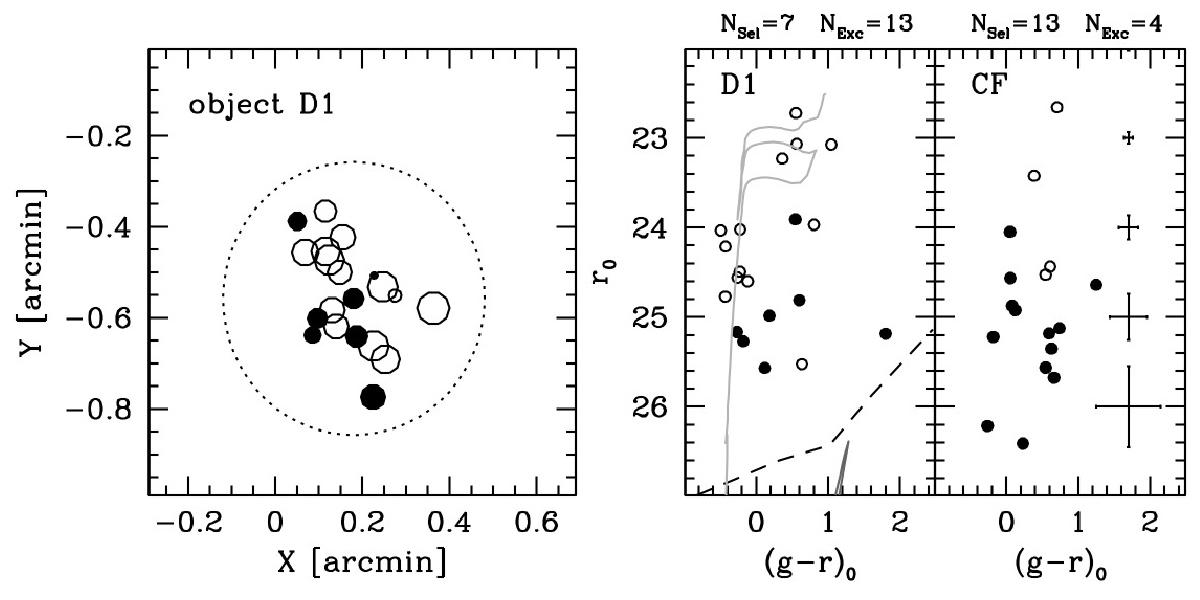
Left panel: maps of the sources in the catalogue of Field D lying within 18″ (large dotted circle) of the centre of object D1. Filled circles are sources that pass our quality selection, and open circles are sources that would be excluded from the selection. The size of the circles is proportional to the magnitude of a source (larger circles corresponding to brighter sources). Right panels: the CMD of these sources compared to the CMD of a nearby control field of the same size. The meaning of the symbols is the same as for the right panel.The number of selected (NSel) and excluded (NExc) stars is reported on top of each panel. The dashed line marks the level of the limiting magnitude as a function of colour for this field. On the D1 CMD we have superimposed two theoretical isochrones from the Marigo et al. (2008) set, with metallicity Z = 0.001 and age 28 Myr (light grey line) and 12.5 Gyr (dark grey line), shifted to a distance of D = 7.2 Mpc.
Current usage metrics show cumulative count of Article Views (full-text article views including HTML views, PDF and ePub downloads, according to the available data) and Abstracts Views on Vision4Press platform.
Data correspond to usage on the plateform after 2015. The current usage metrics is available 48-96 hours after online publication and is updated daily on week days.
Initial download of the metrics may take a while.