Free Access
Fig. 2
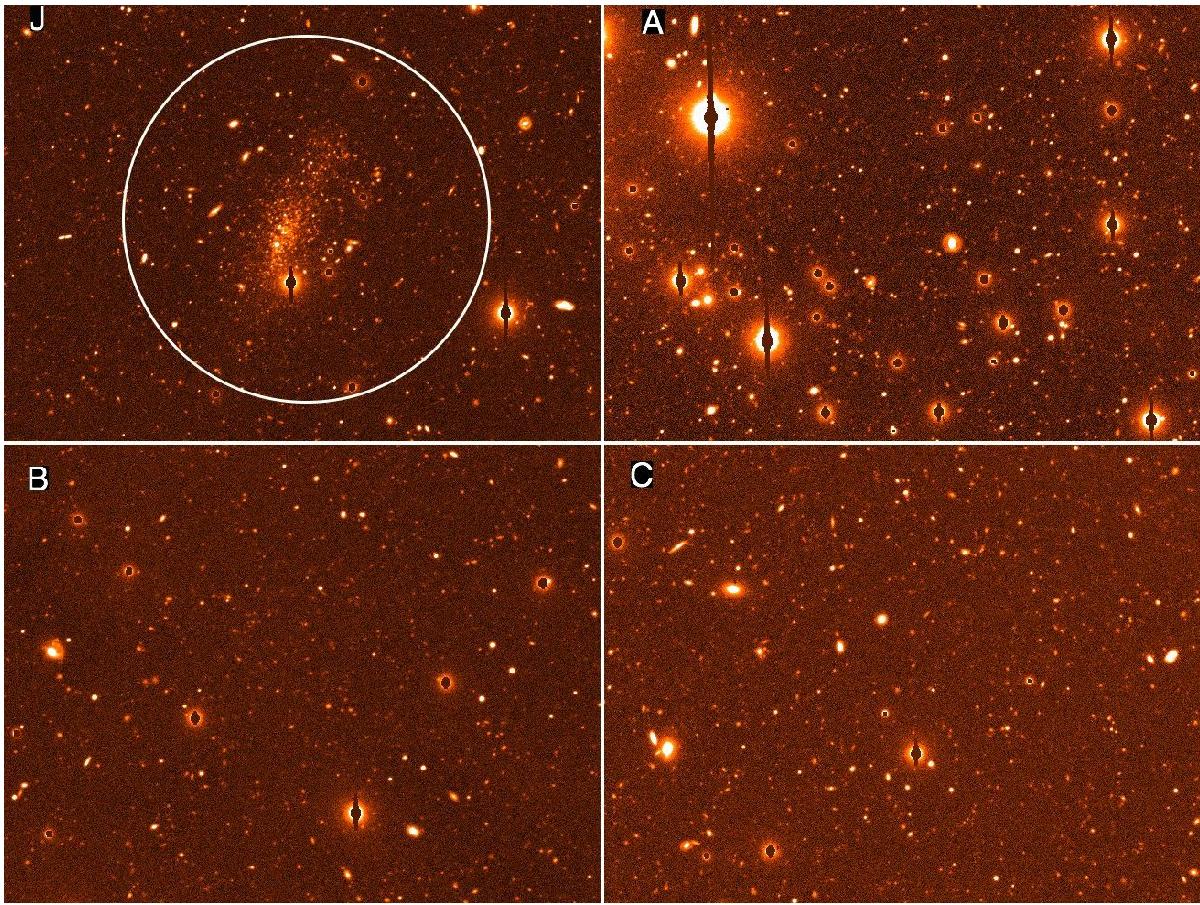
Portions of the r-band stacked images for fields J, A, B, and C, centred on the position of the associated UCHVCs. All the images shown here have the same size. In the upper left panel, a circle with radius r = 1.5′ is plotted for reference. In all the images, north is up and east is to the left.
Current usage metrics show cumulative count of Article Views (full-text article views including HTML views, PDF and ePub downloads, according to the available data) and Abstracts Views on Vision4Press platform.
Data correspond to usage on the plateform after 2015. The current usage metrics is available 48-96 hours after online publication and is updated daily on week days.
Initial download of the metrics may take a while.