Fig. 12
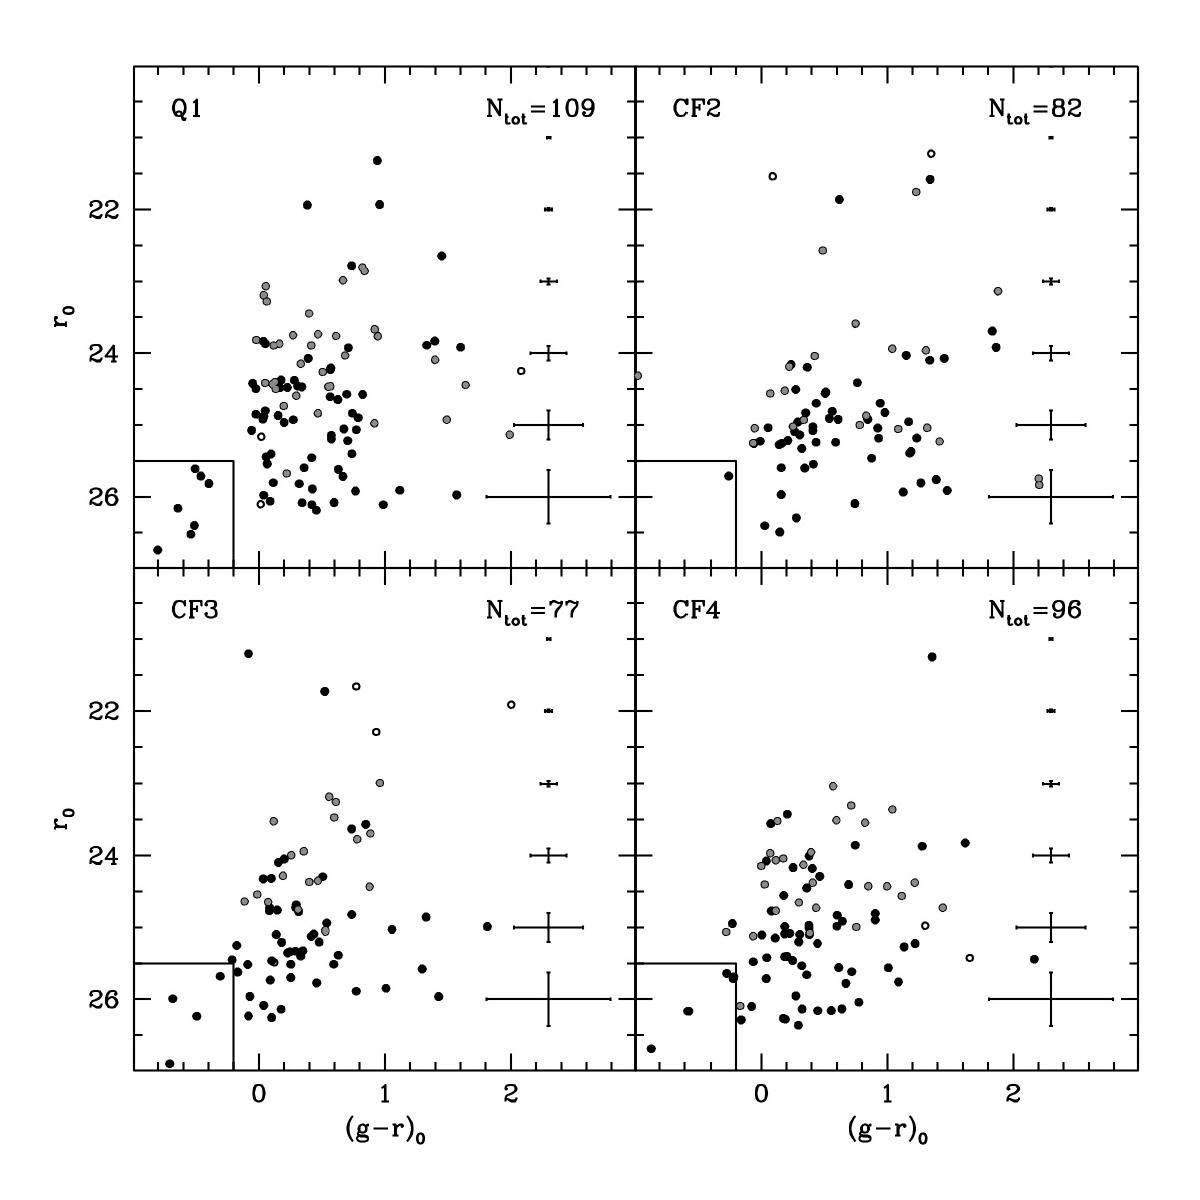
Comparison of the Q1 over-density CMD with three control fields with the same area. The Q1 CMD includes all sources within a circle of radius r = 45″ of the centre of the UCHVC associated with Field Q. Black filled circles are sources that pass our CHI and SHARP selection, grey circles are sources that do not pass the selection because of positive SHARP values that are higher than the adopted limit (extended sources), and empty circles are sources that do not pass the selection for other reasons. The total number of sources plotted in each CMD (Ntot) is reported. The faint blue sources discussed in the text are enclosed in a rectangle in the lower left corner of each CMD.
Current usage metrics show cumulative count of Article Views (full-text article views including HTML views, PDF and ePub downloads, according to the available data) and Abstracts Views on Vision4Press platform.
Data correspond to usage on the plateform after 2015. The current usage metrics is available 48-96 hours after online publication and is updated daily on week days.
Initial download of the metrics may take a while.