Fig. 8
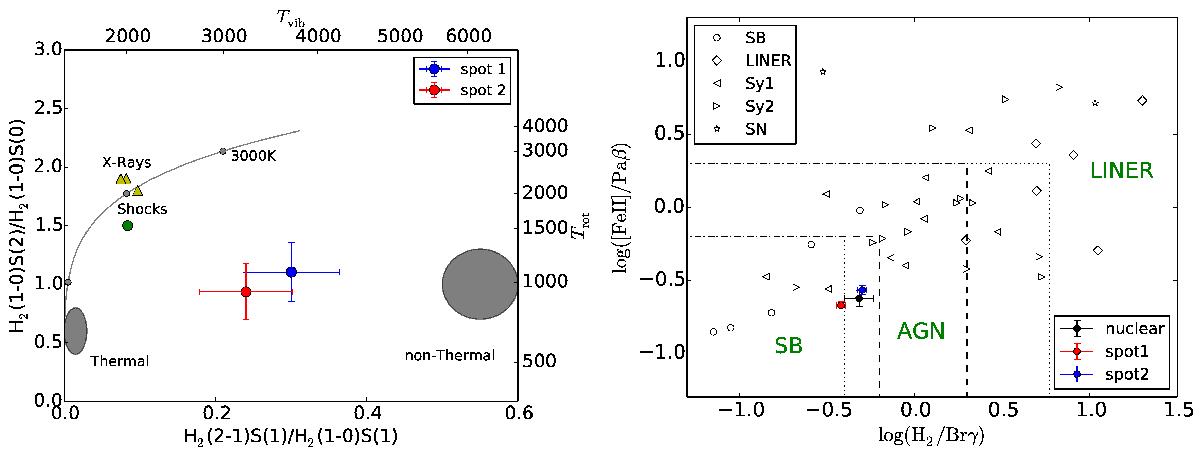
Left: molecular hydrogen diagnostic diagram with 2–1S(1)/1–0S(1) vs. 1–0S(2)/1–0S(0) (Mouri 1994). Spot 1 and 2 are indicated by blue and red points. The location of thermal UV excitation (Sternberg & Dalgarno 1989) and non-thermal models (Black & van Dishoeck 1987), as well as the thermal emission curve from 1000 K to 3000 K, are plotted in gray. The X-ray heating models (Draine & Woods 1990) are marked by yellow triangles, the shock-heating model (Brand et al. 1989) by a green circle. Right: diagnostic diagram with line ratios 1–0S(1)λ2.121 μm/Brγ vs. [Fe ii]λ1.257 μm/Paβ (for details see text). The positions of three apertures are indicated by circles. Open symbols correspond to literature values from Larkin et al. (1998), Dale et al. (2004), and Rodríguez-Ardila et al. (2004, 2005). The lines indicate regions that are typically populated by starburst galaxies, AGNs, and LINERs resp. Dashed lines: Rodríguez-Ardila et al. (2005) and Riffel et al. (2010), dotted lines: Riffel et al. (2013).
Current usage metrics show cumulative count of Article Views (full-text article views including HTML views, PDF and ePub downloads, according to the available data) and Abstracts Views on Vision4Press platform.
Data correspond to usage on the plateform after 2015. The current usage metrics is available 48-96 hours after online publication and is updated daily on week days.
Initial download of the metrics may take a while.