Fig. 2
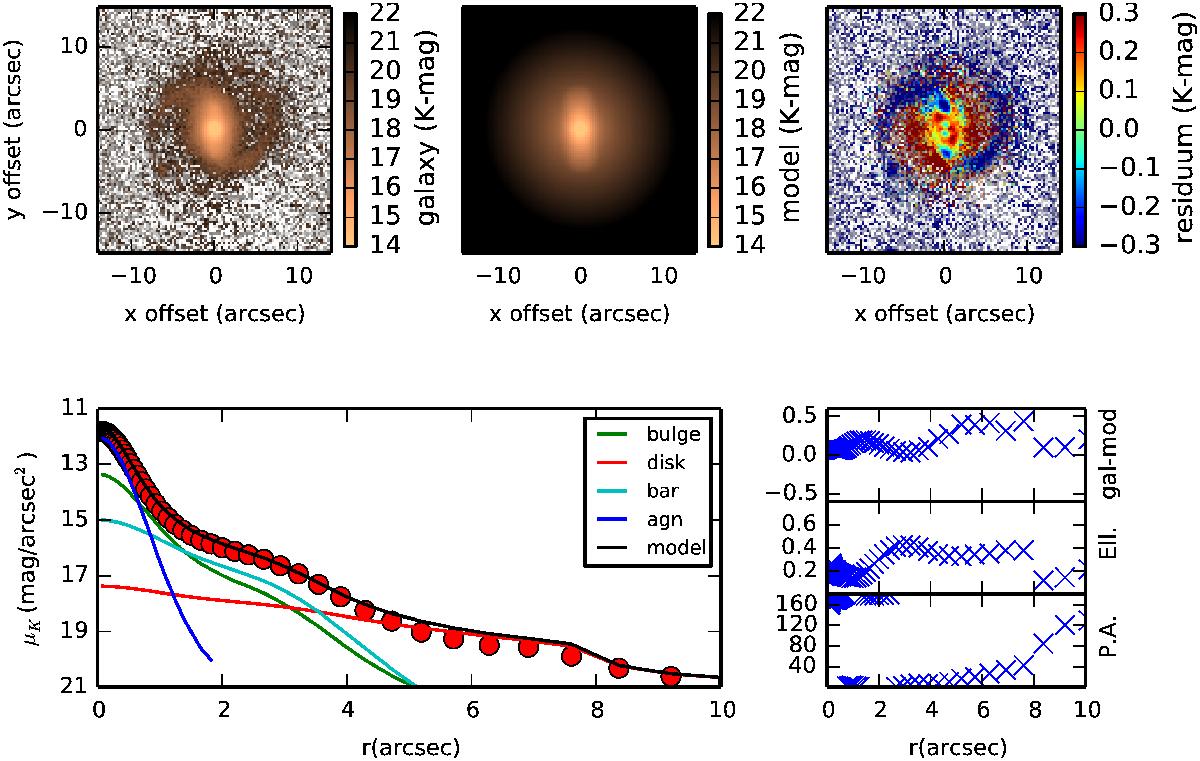
Decomposition of HE 1029-1831 with Budda. We show (from left to right) the original K-band ISAAC-image, the Budda-model, and the residuum obtained by division galaxy/model. Here, blue indicates that the original image has more flux than the model while red indicates that the model has more flux than the original image. In the lower row, we show an elliptically averaged radial profile of the galaxy, the single components, and the model. Next to it, we show the difference galaxy-model, ellipticity, and position angle.
Current usage metrics show cumulative count of Article Views (full-text article views including HTML views, PDF and ePub downloads, according to the available data) and Abstracts Views on Vision4Press platform.
Data correspond to usage on the plateform after 2015. The current usage metrics is available 48-96 hours after online publication and is updated daily on week days.
Initial download of the metrics may take a while.