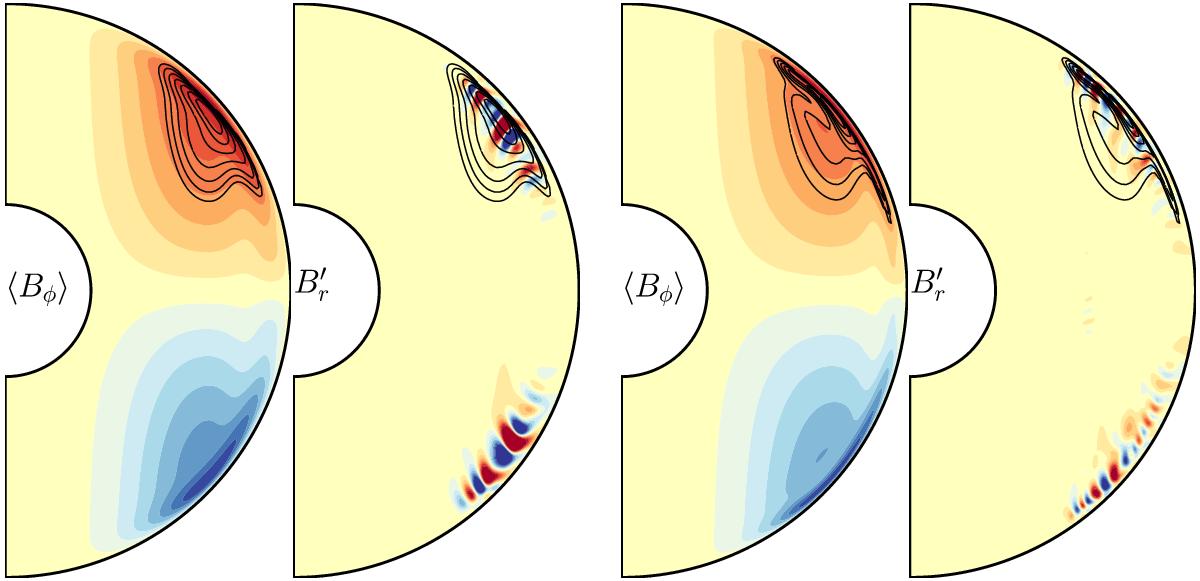
Fig. 7

Azimuthally-averaged toroidal field and meridional cut of the fluctuating radial field during the growing phase of the instability for cases where Re = 2 × 10⁴ and Lup = 60 (left panels) and with Re = 4 × 10⁴ and Lup = 120 (right panels). In the northern hemisphere and for each snapshot, the contours of the growth rate for m = 5 and Ω0/ωAφ0 = 5 predicted by the linear analysis are superimposed to the colour contours.
Current usage metrics show cumulative count of Article Views (full-text article views including HTML views, PDF and ePub downloads, according to the available data) and Abstracts Views on Vision4Press platform.
Data correspond to usage on the plateform after 2015. The current usage metrics is available 48-96 hours after online publication and is updated daily on week days.
Initial download of the metrics may take a while.


