Fig. 2
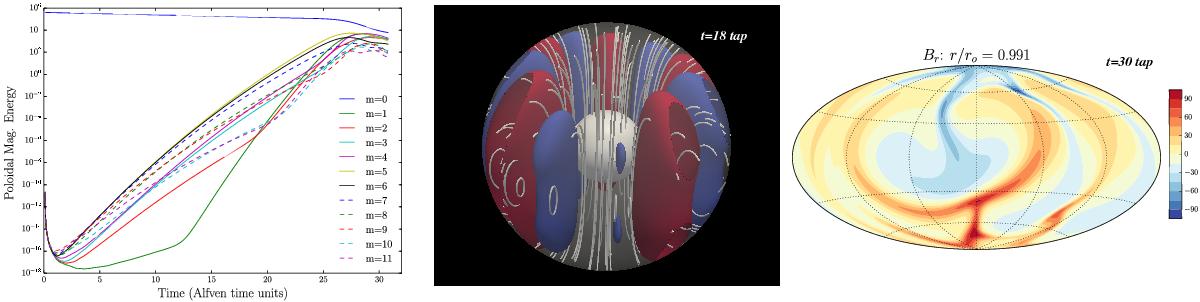
Lup = 200: temporal evolution of the magnetic energy contained in the first azimuthal wavenumbers (left), volume rendering showing isosurfaces of the fluctuating part of the radial magnetic field ![]() together with magnetic field lines during the linear phase of the instability (middle) and cut of the total radial magnetic field at the top of our domain when the instability has reached a saturated state.
together with magnetic field lines during the linear phase of the instability (middle) and cut of the total radial magnetic field at the top of our domain when the instability has reached a saturated state.
Current usage metrics show cumulative count of Article Views (full-text article views including HTML views, PDF and ePub downloads, according to the available data) and Abstracts Views on Vision4Press platform.
Data correspond to usage on the plateform after 2015. The current usage metrics is available 48-96 hours after online publication and is updated daily on week days.
Initial download of the metrics may take a while.