Fig. 2
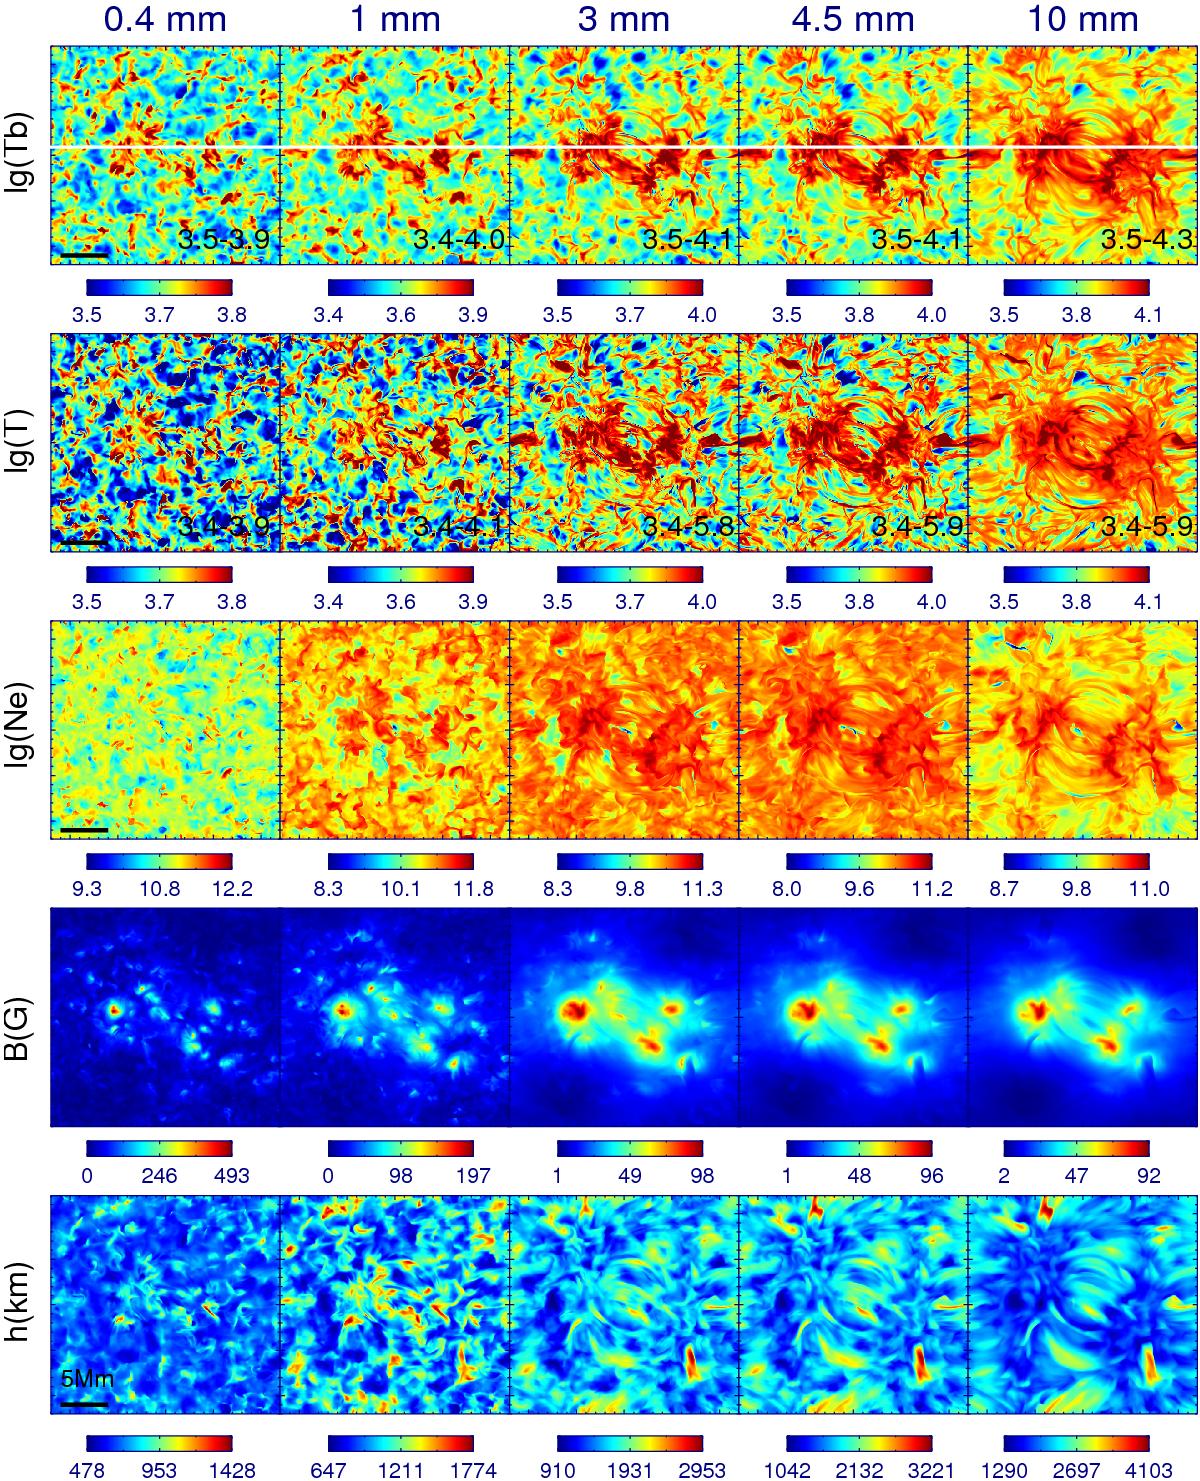
Maps of simulated mm brightness at the resolution of the model for the wavelengths 0.4, 1.0, 3.0, 4.5, and 10 mm (labeled in the top row). The horizontal white line in the top row marks the position of the vertical cut at Y = 0.9 Mm displayed in Fig. 5. We also plot the effective formation heights of the mm radiation (bottom row) and the corresponding electron temperatures, electron number densities, and magnetic field strength taken at the effective formation heights (three middle rows). The values of the most extreme 1% of points are clipped in the brightness maps. The displayed temperature range for electron temperatures is set to that of the mm brightness maps. The range of covered temperatures is given near the bottom of the frames. The field size is 24 Mm × 24 Mm.
Current usage metrics show cumulative count of Article Views (full-text article views including HTML views, PDF and ePub downloads, according to the available data) and Abstracts Views on Vision4Press platform.
Data correspond to usage on the plateform after 2015. The current usage metrics is available 48-96 hours after online publication and is updated daily on week days.
Initial download of the metrics may take a while.