Fig. 12
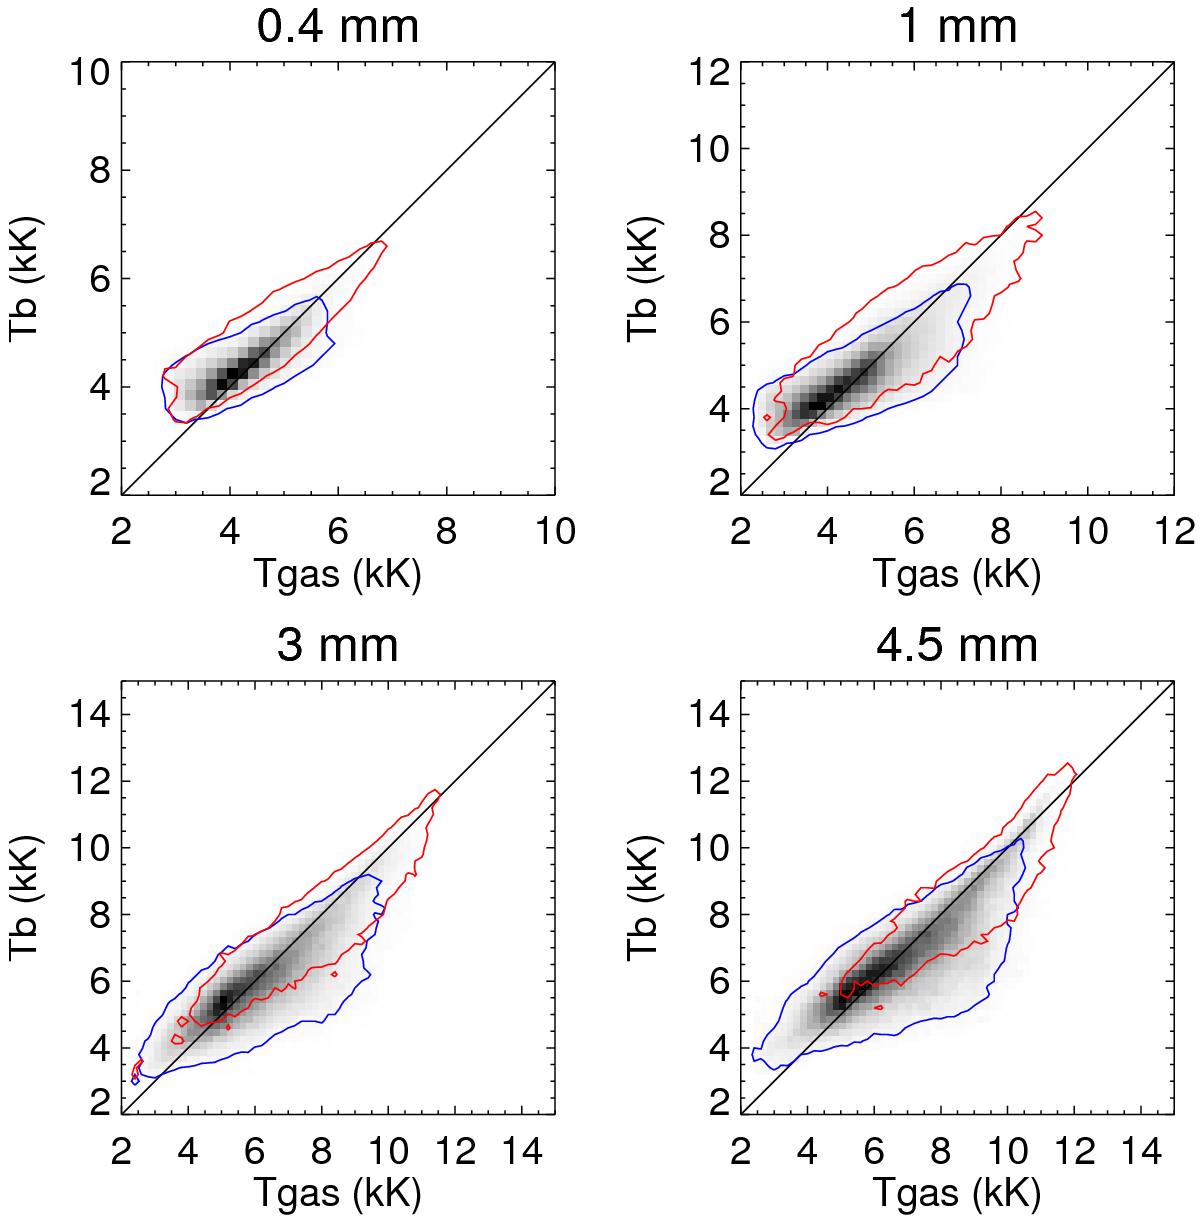
Density scatter plots (2D histograms) of the brightness temperature Tb versus gas temperature Tgas taken at the effective formation heights for 0.4 mm, 1 mm, 3 mm, and 4.5 mm. Darker color indicates more pixels in the bin. Solid lines denote Tb = Tgas. Blue contour (dark gray in the printed version) encloses 95% of the spatial locations with weak magnetic field (| B | < 30 G at the effective formation height), red contour (light gray in the printed version) includes 95% of the locations of strong magnetic field (| B | ≥ 30 G at the effective formation height).
Current usage metrics show cumulative count of Article Views (full-text article views including HTML views, PDF and ePub downloads, according to the available data) and Abstracts Views on Vision4Press platform.
Data correspond to usage on the plateform after 2015. The current usage metrics is available 48-96 hours after online publication and is updated daily on week days.
Initial download of the metrics may take a while.