Fig. 9
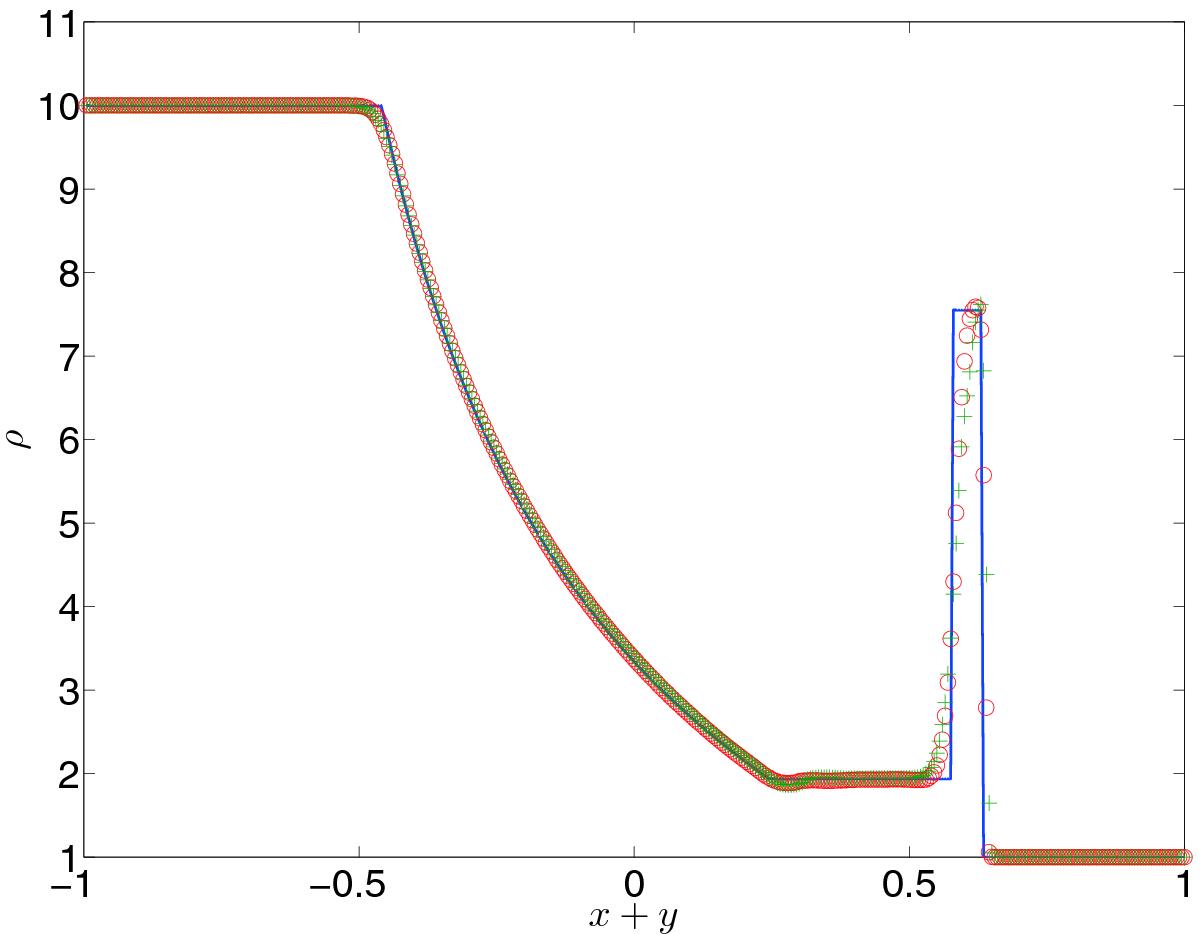
Cross-section of the evolution of the mildly relativistic shock-wave across the grid shown in Fig. 8. The run was performed using the GFORCE1 scheme at a CFL of 0.95, and using the van Leer slope-limiter. The green + signs are the numerical solution on the overlapping grid, the red circles are from an equivalent simulation on a single 2D Cartesian grid, and the blue line is the exact solution for the problem. The two numerical solutions have been interpolated from along the line x = y.
Current usage metrics show cumulative count of Article Views (full-text article views including HTML views, PDF and ePub downloads, according to the available data) and Abstracts Views on Vision4Press platform.
Data correspond to usage on the plateform after 2015. The current usage metrics is available 48-96 hours after online publication and is updated daily on week days.
Initial download of the metrics may take a while.