Free Access
Fig. 7
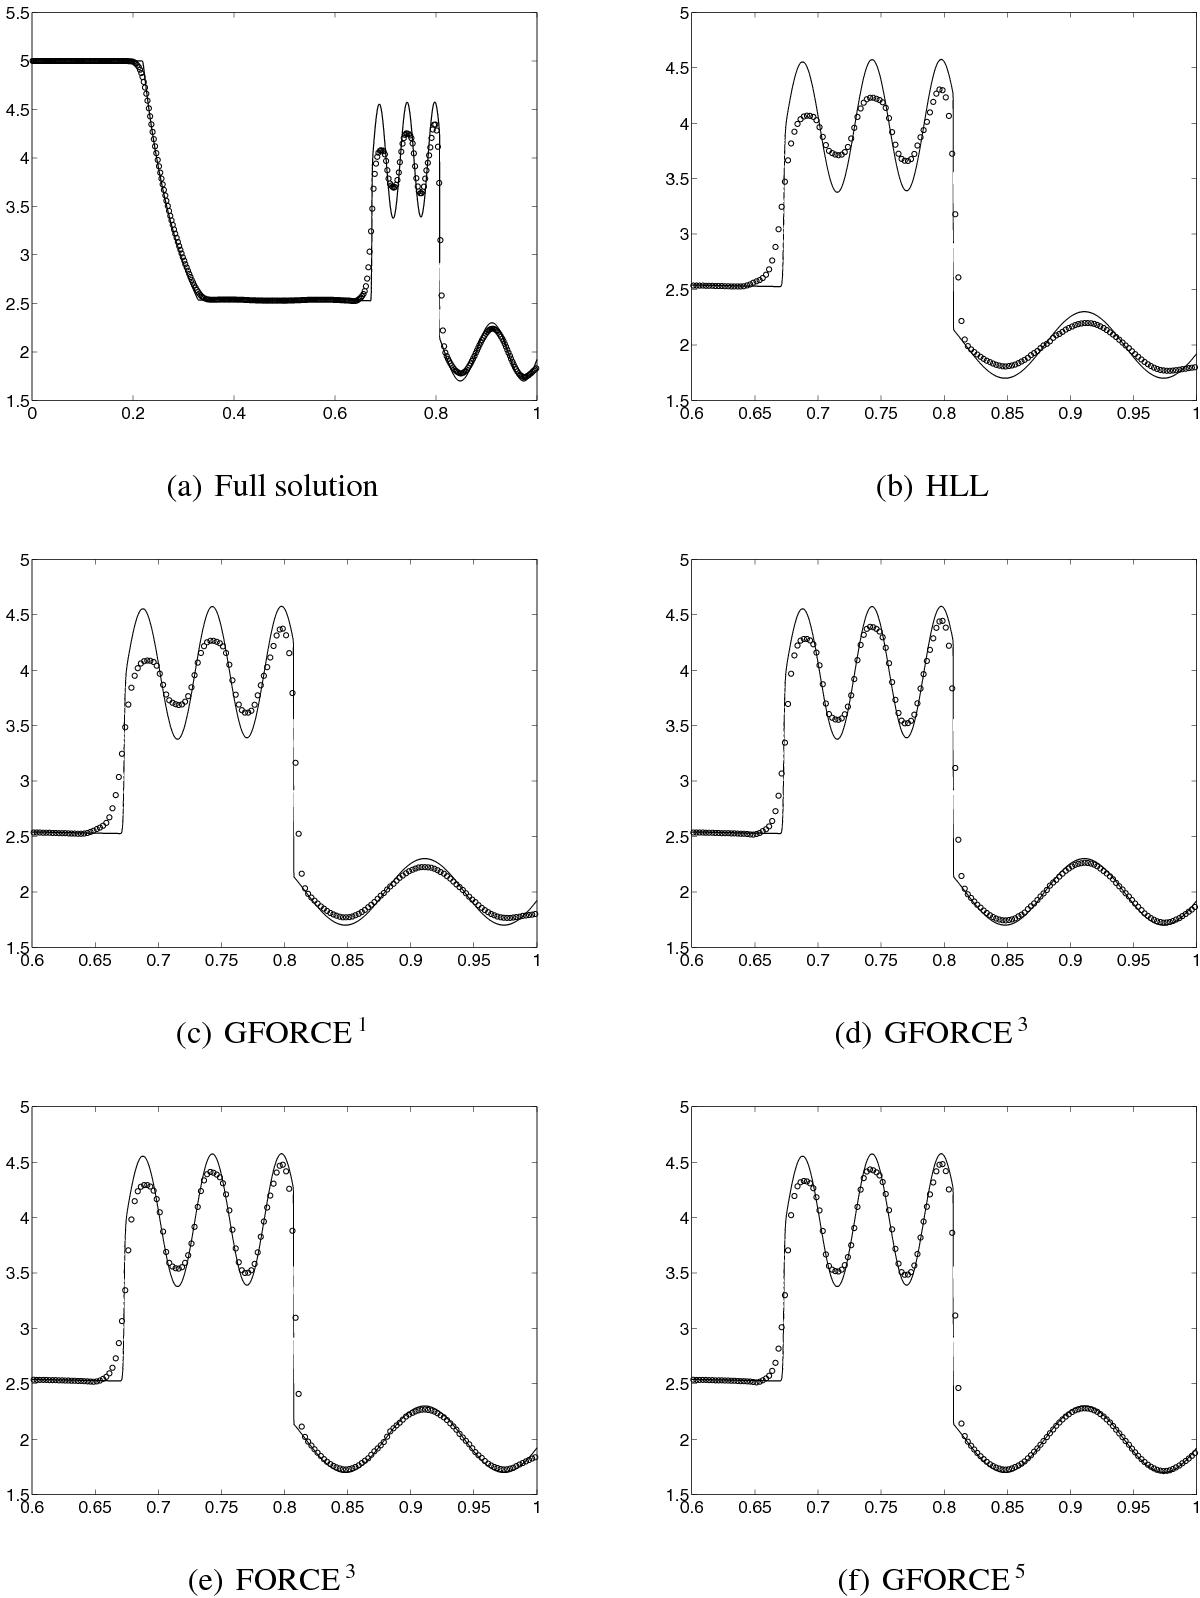
Results for the density-perturbation initial conditions. The first plot shows a full solution obtained using the SLIC scheme based on FORCE1. The other plots show close-ups of the density when replacing FORCE by other schemes. For all results, a CFL of 0.99 and the van Leer limiter were used, on a grid of 400 cells.
Current usage metrics show cumulative count of Article Views (full-text article views including HTML views, PDF and ePub downloads, according to the available data) and Abstracts Views on Vision4Press platform.
Data correspond to usage on the plateform after 2015. The current usage metrics is available 48-96 hours after online publication and is updated daily on week days.
Initial download of the metrics may take a while.