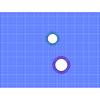
Fig. 14
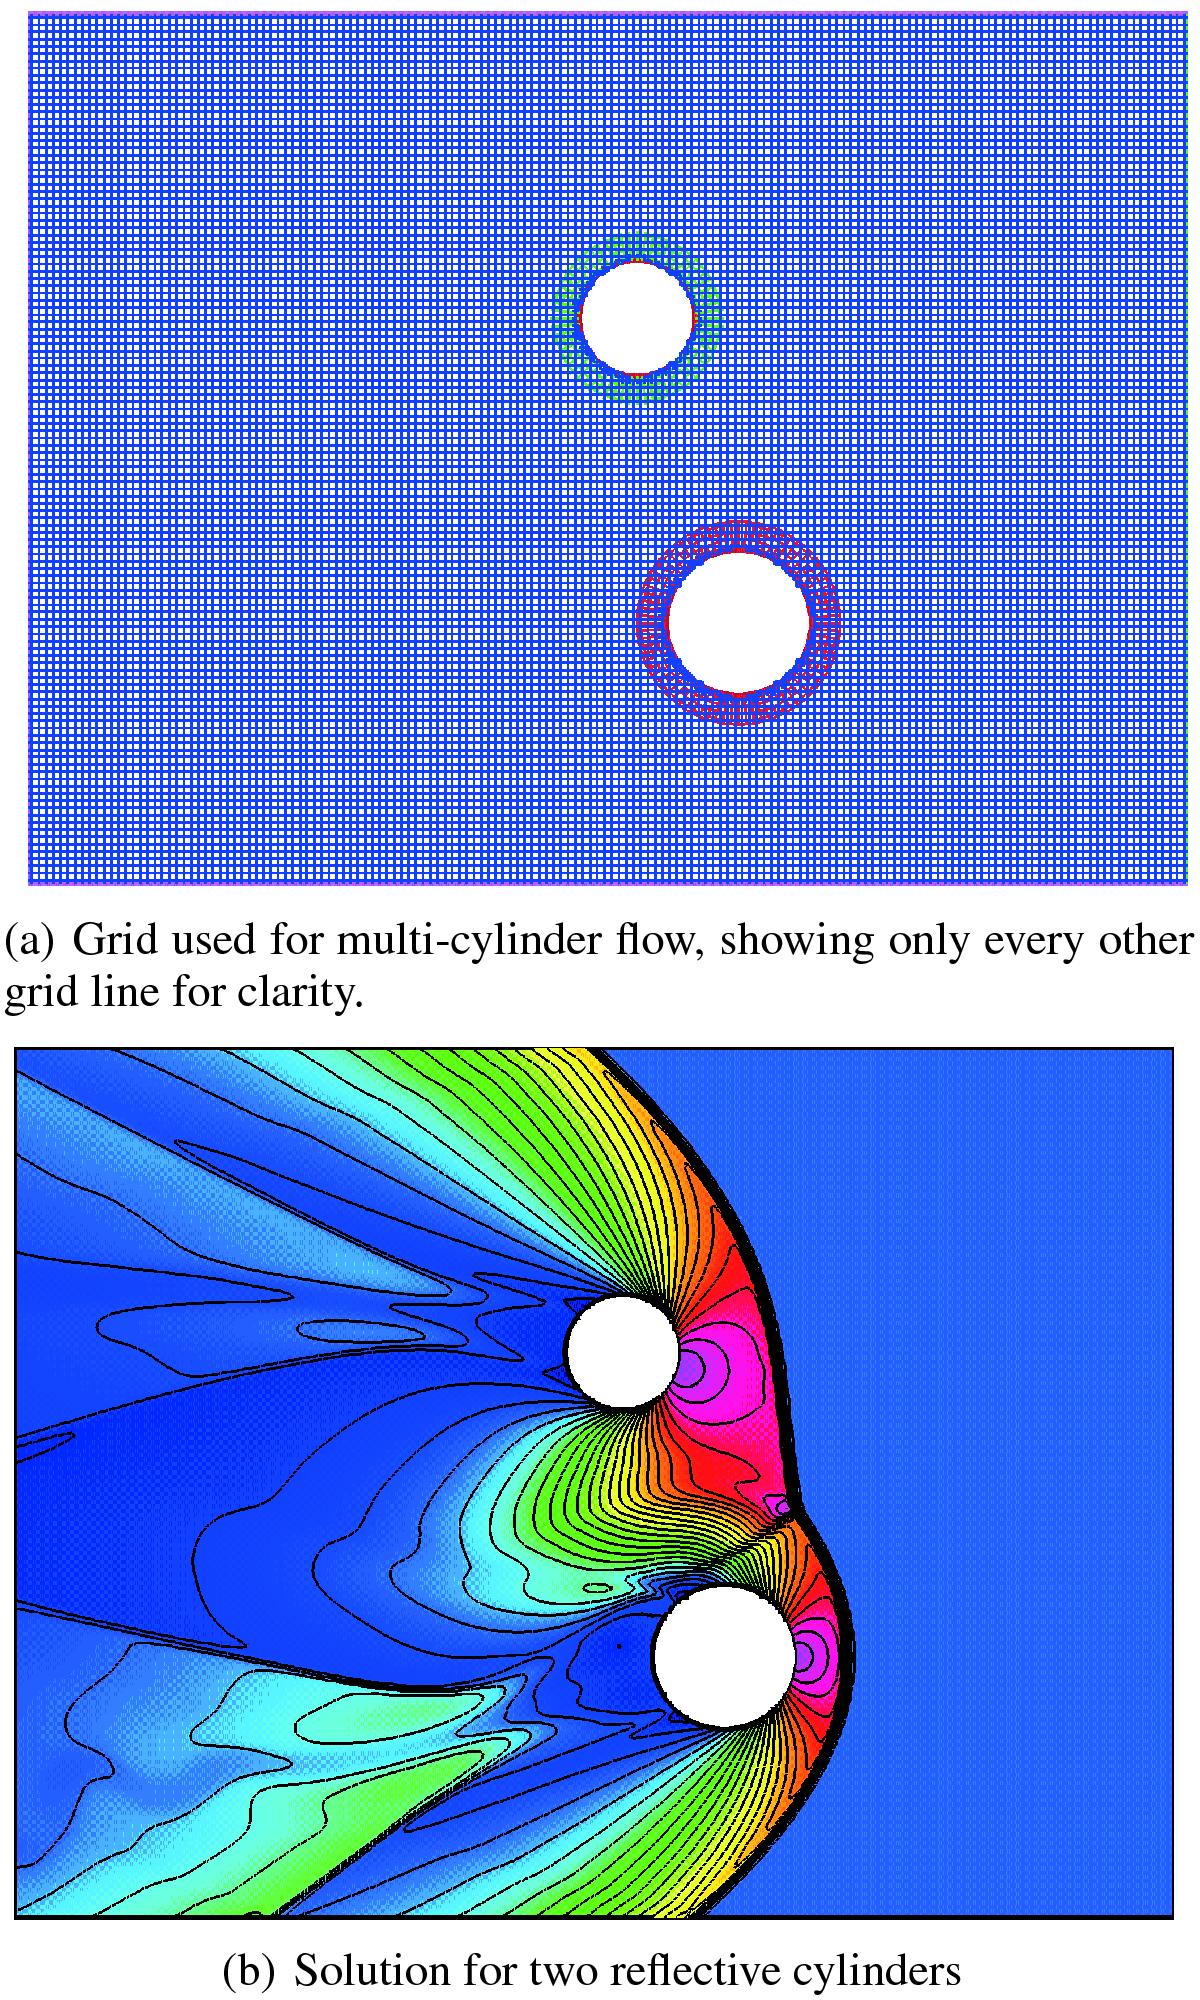
Simulation of flow past two solid cylinders. The first plot shows the grid and in the second we plot 30 contours of ρ from 0 to 10 for two solid cylinders initially immersed in a fluid of constant state, Mach 3 and velocity 0.8, with density 1.4 and adiabatic index 1.4. The solution is shown at time 10. The GFORCE1 scheme was used, with the van Leer slope-limiter, and a CFL of 0.95.
Current usage metrics show cumulative count of Article Views (full-text article views including HTML views, PDF and ePub downloads, according to the available data) and Abstracts Views on Vision4Press platform.
Data correspond to usage on the plateform after 2015. The current usage metrics is available 48-96 hours after online publication and is updated daily on week days.
Initial download of the metrics may take a while.