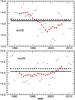
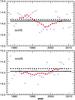
Fig. 1

Left-hand panels: yearly values of Ω17 in units of deg/day in the north (top) and south (bottom) for X-ray flares. Open circles stand for the yearly best-fit values, filled circles demonstrate the 11-point running mean values. The solid horizontal line denotes the average Ω17 over the entire study period, the dashed line the sidereal Carrington rotation rate. Right-hand panels: the same as in the left-hand panels, but for sunspots.
Current usage metrics show cumulative count of Article Views (full-text article views including HTML views, PDF and ePub downloads, according to the available data) and Abstracts Views on Vision4Press platform.
Data correspond to usage on the plateform after 2015. The current usage metrics is available 48-96 hours after online publication and is updated daily on week days.
Initial download of the metrics may take a while.