Fig. 5
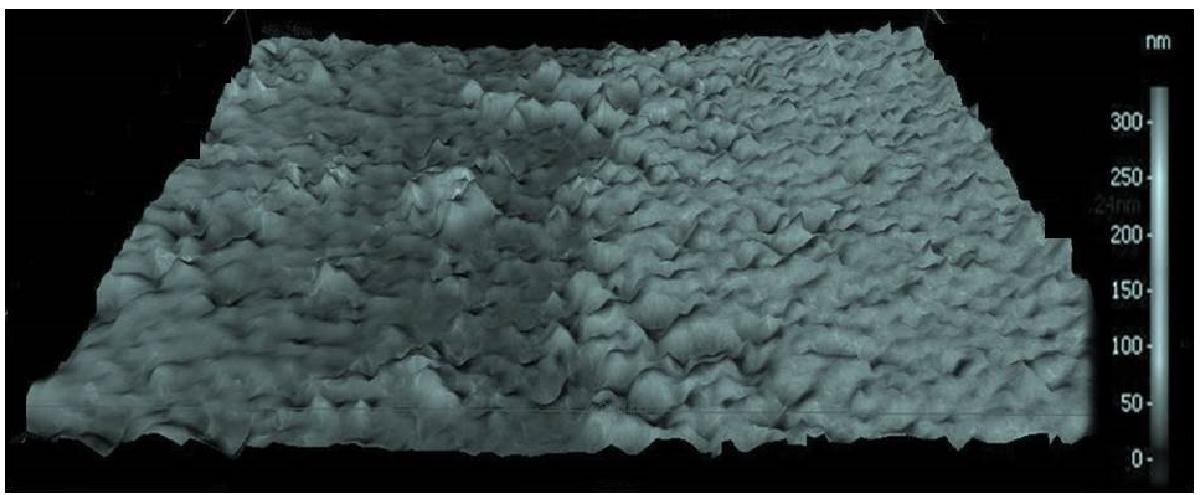
Topographic view produced from a FESEM micrograph showing the erosion of the carbon layer after ion bombardment with 6.76 × 10¹⁶ protons/cm2. The left part is the bombarded area whereas the right and bright surface represents the nonirradiated part of the sample. The scale on the right side corresponds to the layer thickness.
Current usage metrics show cumulative count of Article Views (full-text article views including HTML views, PDF and ePub downloads, according to the available data) and Abstracts Views on Vision4Press platform.
Data correspond to usage on the plateform after 2015. The current usage metrics is available 48-96 hours after online publication and is updated daily on week days.
Initial download of the metrics may take a while.