Free Access
Fig. 4
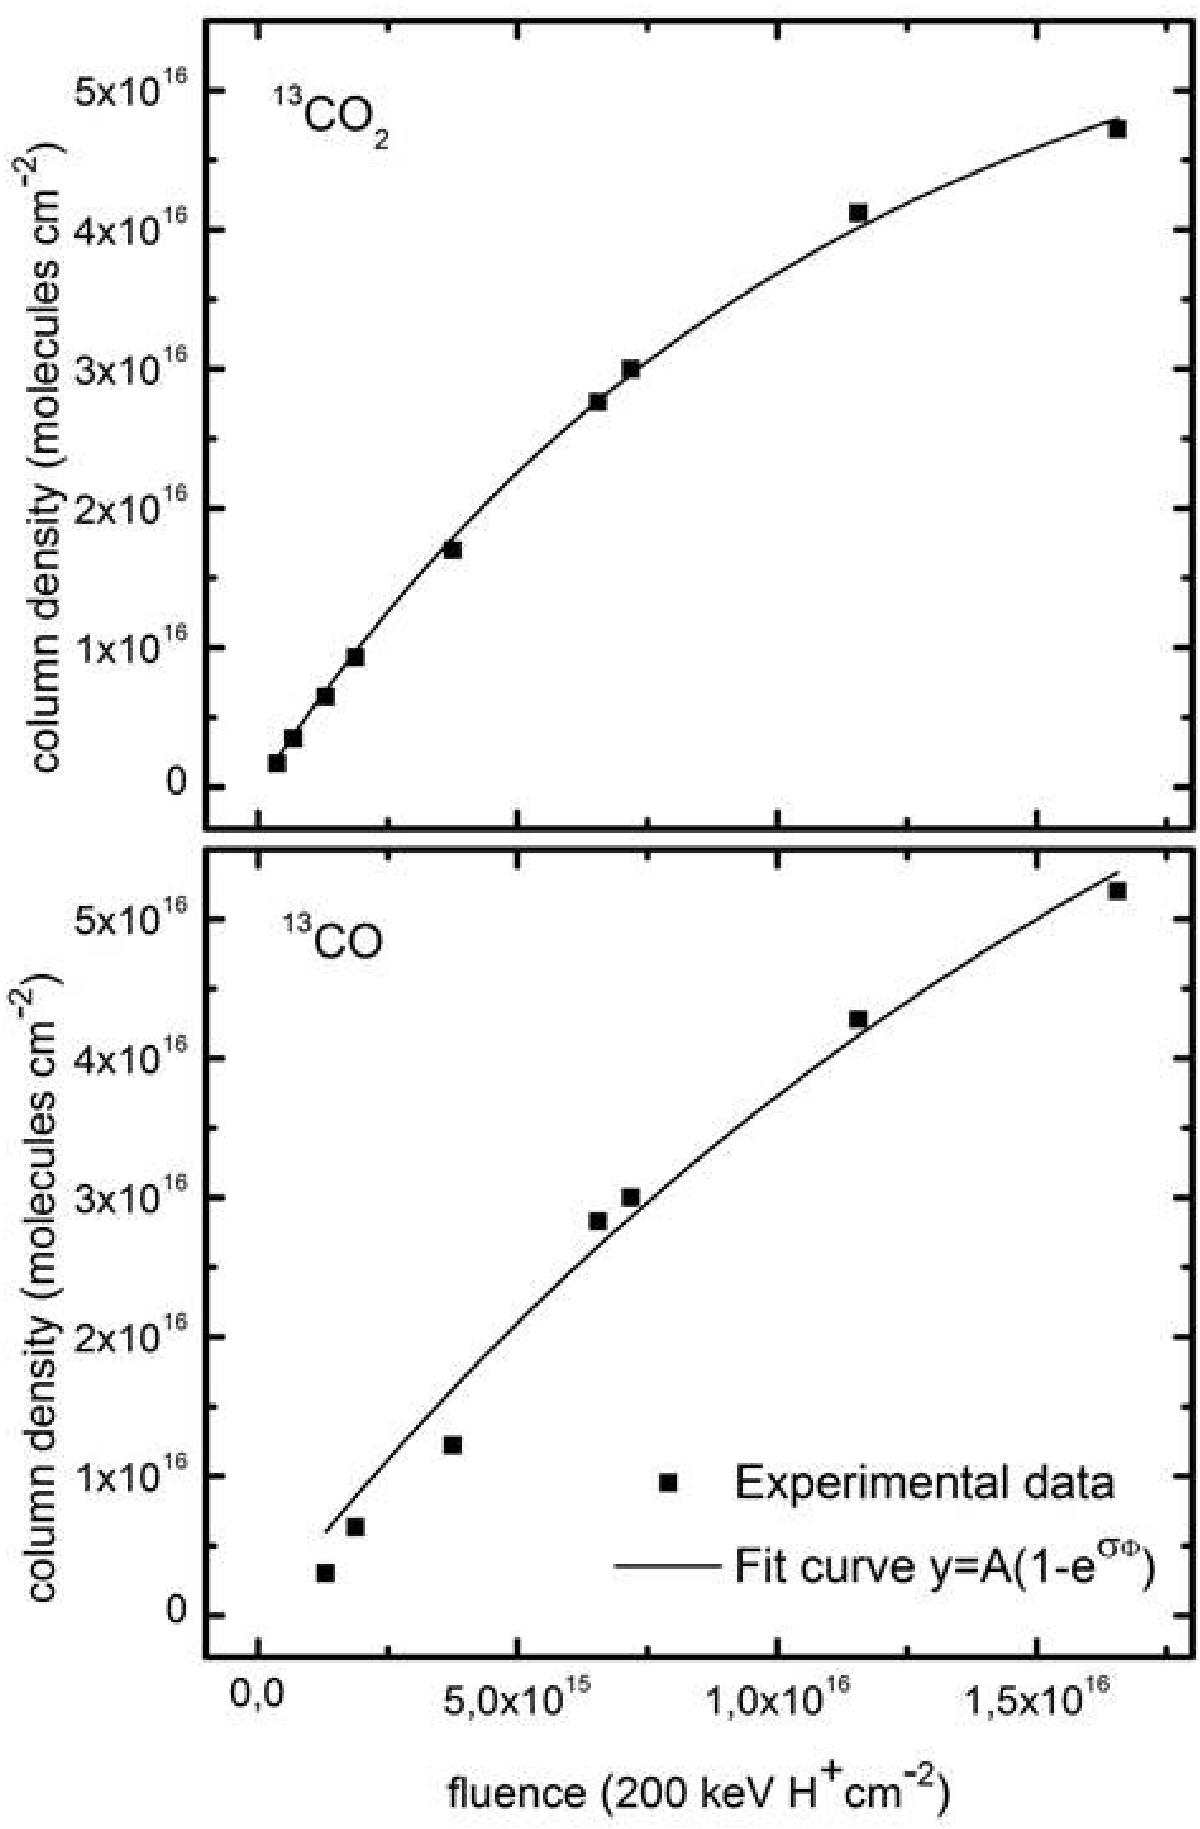
Column densities of 13CO (lower graph) and 13CO2 (upper graph) versus the fluence. The formation rates of both molecules were derived from the fit of the experimental data with a standard deviation of δR = ± 0.38 (molecules/ion).
Current usage metrics show cumulative count of Article Views (full-text article views including HTML views, PDF and ePub downloads, according to the available data) and Abstracts Views on Vision4Press platform.
Data correspond to usage on the plateform after 2015. The current usage metrics is available 48-96 hours after online publication and is updated daily on week days.
Initial download of the metrics may take a while.