Fig. 4
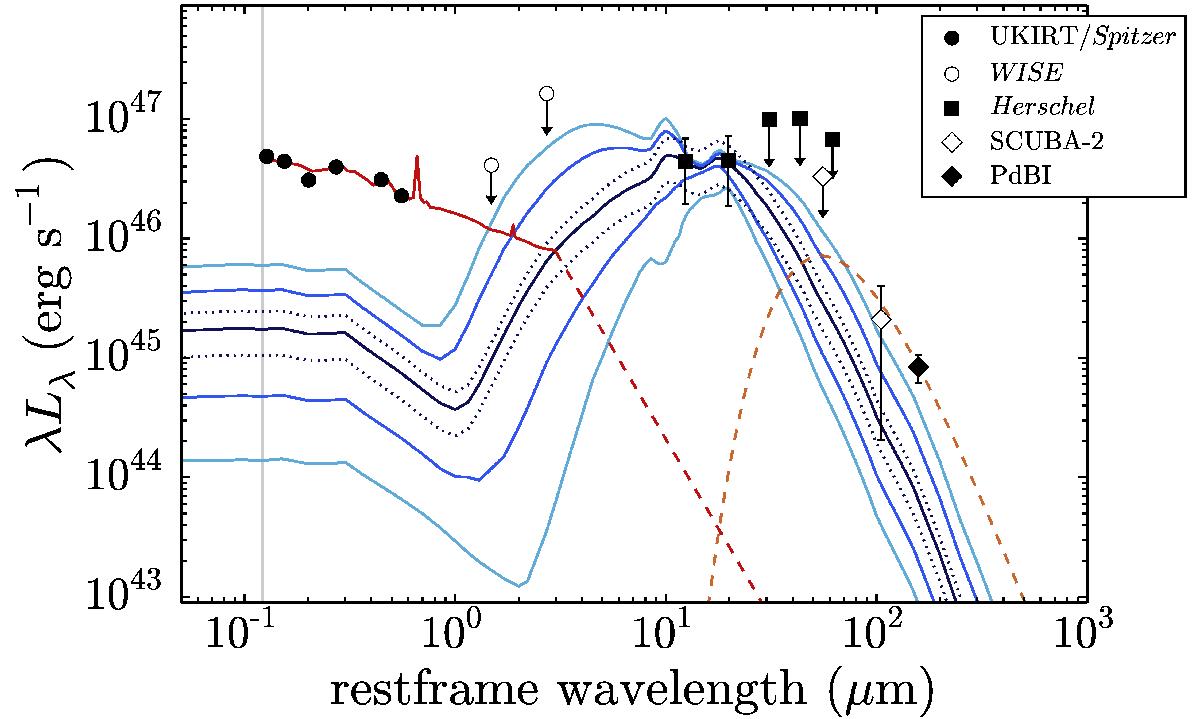
Dusty torus model fits. The data points are the same as in Fig. 2, with the X-ray and radio ranges cropped. The red line represents the AD model, with a break to fν ∝ ν2 indicated by the red dashed line beyond 3 μm in the rest frame (Hönig & Kishimoto 2010). The AD and BB (orange line) models were subtracted from the WISE/Herschel/SCUBA-2 data, and the 960 models of Hönig & Kishimoto (2010) were fitted to the subtracted data. The solid blue lines show the median (darkest) of the fits and the 68% and 95% (lightest) ranges. The dotted blue lines represent the statistical uncertainty for an individual fit.
Current usage metrics show cumulative count of Article Views (full-text article views including HTML views, PDF and ePub downloads, according to the available data) and Abstracts Views on Vision4Press platform.
Data correspond to usage on the plateform after 2015. The current usage metrics is available 48-96 hours after online publication and is updated daily on week days.
Initial download of the metrics may take a while.