Fig. B.1
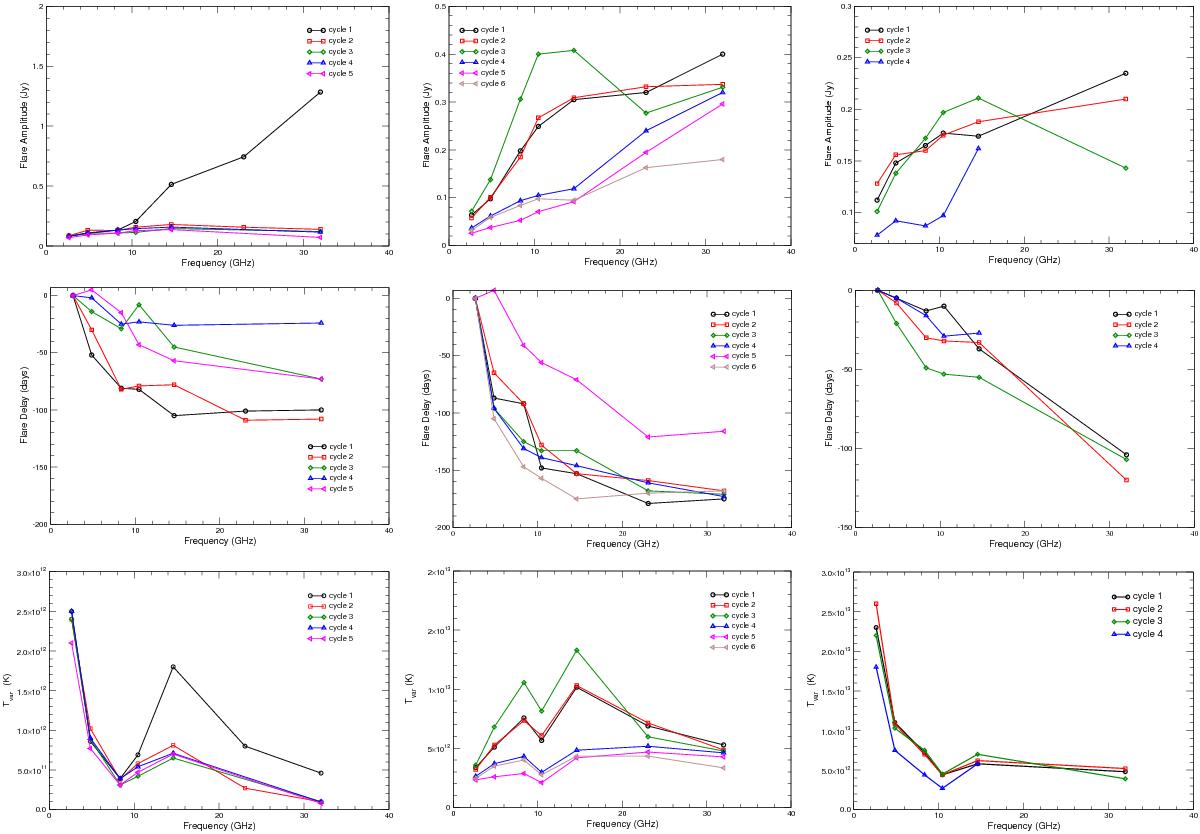
Left column: J0324+3410: top panel: amplitude of the detected flares as a function of observing frequency with the cycle labels corresponding to the events seen in Fig. 2; middle panel: flare delays; bottom panel: Tvar for the different activity cycles (flares) as a function of observing frequency. Middle column: J0948+0022. Right column: J1505+0326.
Current usage metrics show cumulative count of Article Views (full-text article views including HTML views, PDF and ePub downloads, according to the available data) and Abstracts Views on Vision4Press platform.
Data correspond to usage on the plateform after 2015. The current usage metrics is available 48-96 hours after online publication and is updated daily on week days.
Initial download of the metrics may take a while.