Fig. 2
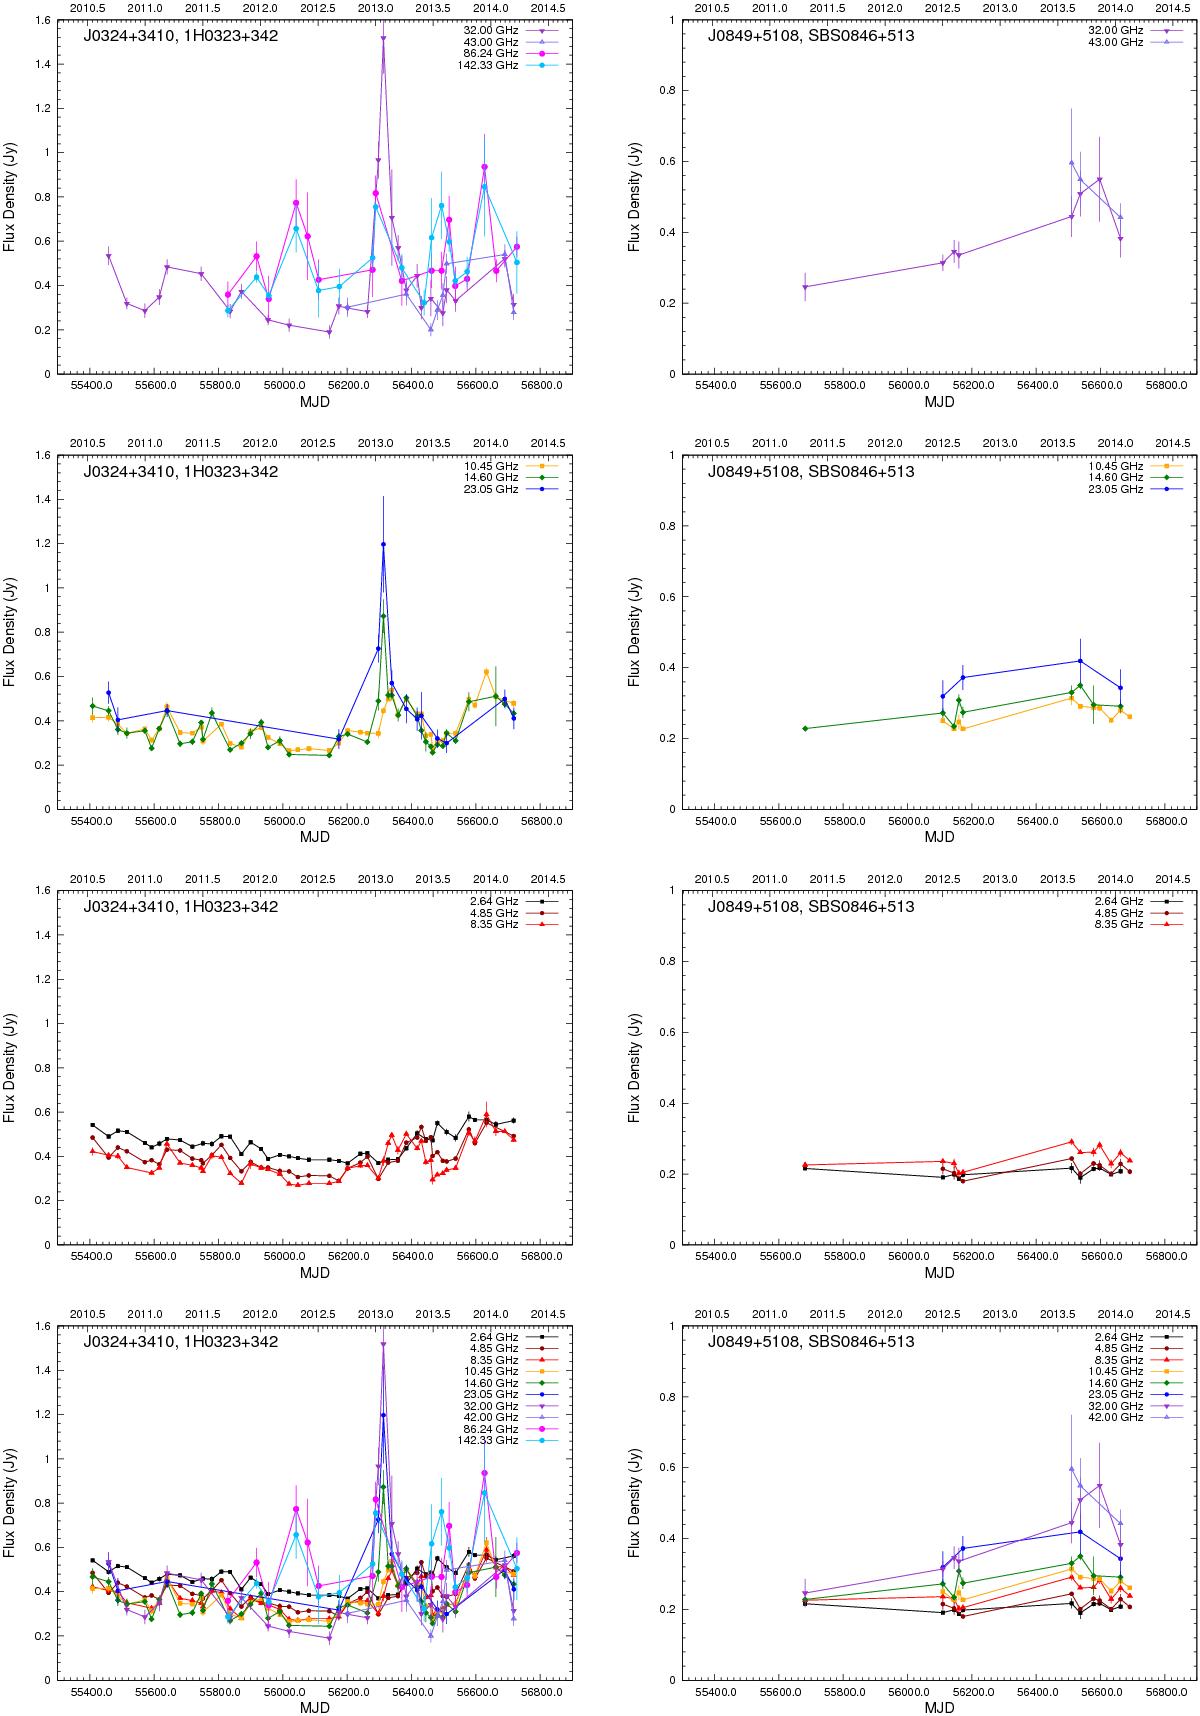
Radio light curves available for J0324+3410 (left column) and J0849+5108 (right column) at all available frequencies. From top to bottom we present the light curves three different frequency bands: low: 2.64, 4.85 and 8.35 GHz, intermediate: 10.45, 14.60 and 23.05 GHz, and high: 32, 43.05, 86.24 (when available) and 142.33 GHz (when available). At the very bottom the datasets are shown over-plotted together for comparison. For the same reason, for each source and axes the boundaries are kept identical. Lines connecting the data points have been used everywhere to facilitate visual inspection. Each frequency is consistently represented by the same colour and symbol. Only data points with a S/N better than 3 have been used.
Current usage metrics show cumulative count of Article Views (full-text article views including HTML views, PDF and ePub downloads, according to the available data) and Abstracts Views on Vision4Press platform.
Data correspond to usage on the plateform after 2015. The current usage metrics is available 48-96 hours after online publication and is updated daily on week days.
Initial download of the metrics may take a while.