Fig. 1
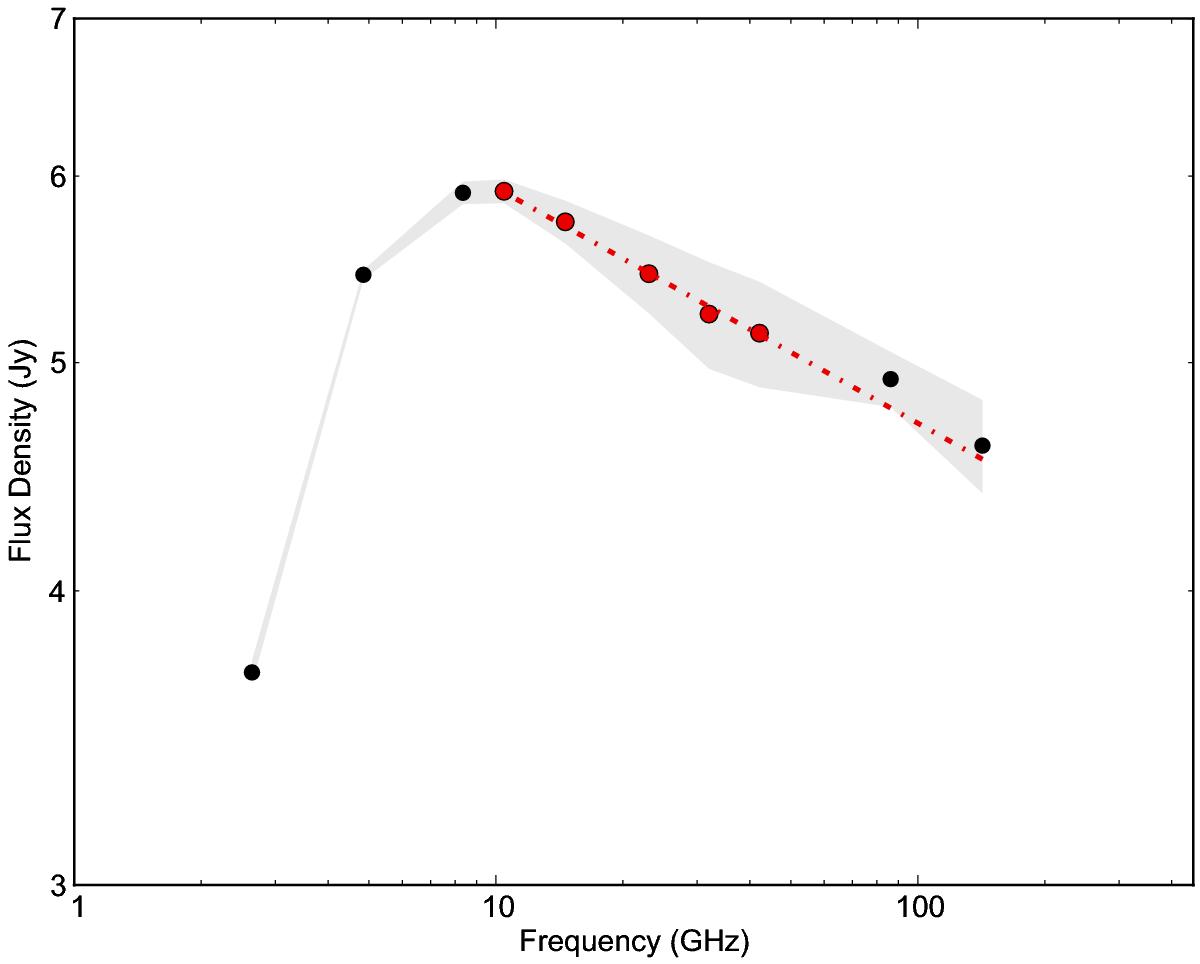
Observed radio SED of NGC 7027 (Zijlstra et al. 2008) over the same period of time as the time baseline covered here. All the Effelsberg frequencies from 2.64 up to the highest IRAM frequency of 142.33 GHz are shown. The filled circles (red and black) denote the measurements. The red symbols mark the Effelsberg measurements that where used in the fit, the red dotted-dashed line is the fitted spectrum. The grey area denotes the 1σ region around each data point. The agreement of the extrapolated values with those measured by IRAM is better than 3%.
Current usage metrics show cumulative count of Article Views (full-text article views including HTML views, PDF and ePub downloads, according to the available data) and Abstracts Views on Vision4Press platform.
Data correspond to usage on the plateform after 2015. The current usage metrics is available 48-96 hours after online publication and is updated daily on week days.
Initial download of the metrics may take a while.