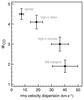
Fig. 14

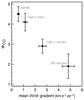
Comparison of the αCO conversion factor to the bulk of ISM turbulence (left: rms 3D velocity dispersion divided by ![]() , mass-weighted average of the measurements for gas identified as molecular) and to the velocity gradient along lines of sight of molecular emission (right: mass-weighted average of the dV/dr gradient along lines-of-sight crossing gas identified as molecular). Average values and rms scatter are displayed for each galaxy type and for the giant clumps of high-z galaxies.
, mass-weighted average of the measurements for gas identified as molecular) and to the velocity gradient along lines of sight of molecular emission (right: mass-weighted average of the dV/dr gradient along lines-of-sight crossing gas identified as molecular). Average values and rms scatter are displayed for each galaxy type and for the giant clumps of high-z galaxies.
Current usage metrics show cumulative count of Article Views (full-text article views including HTML views, PDF and ePub downloads, according to the available data) and Abstracts Views on Vision4Press platform.
Data correspond to usage on the plateform after 2015. The current usage metrics is available 48-96 hours after online publication and is updated daily on week days.
Initial download of the metrics may take a while.